

Innovation can come from anywhere but just because you can, doesn’t mean you should which is why we reserve our superpowers for those that share our values.
Good design is inclusive. It takes care of people and ideally the planet too. We believe good design, delights and solves problems.
Our VALUES
PROJECT
Thrift spot
Digital tool · 2025
WHAT IF it was easy to FIND and SHARE LOCAL TREASURES?
Inspired by the natural behavior of offering up items on the street for neighbors and the challenge of 10 million tons of furniture waste landfilled each year. ThriftSpot enables users to identify items, check market value and list them for sale (locally or on eBay) in a few taps.
PROJECT
Play Path
Playground design · 2025
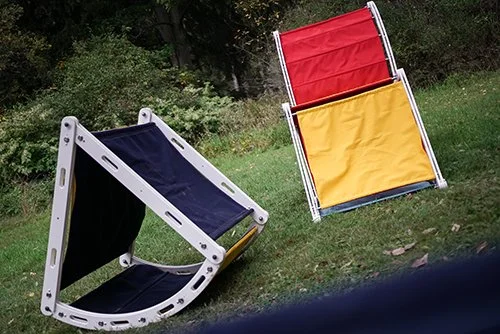
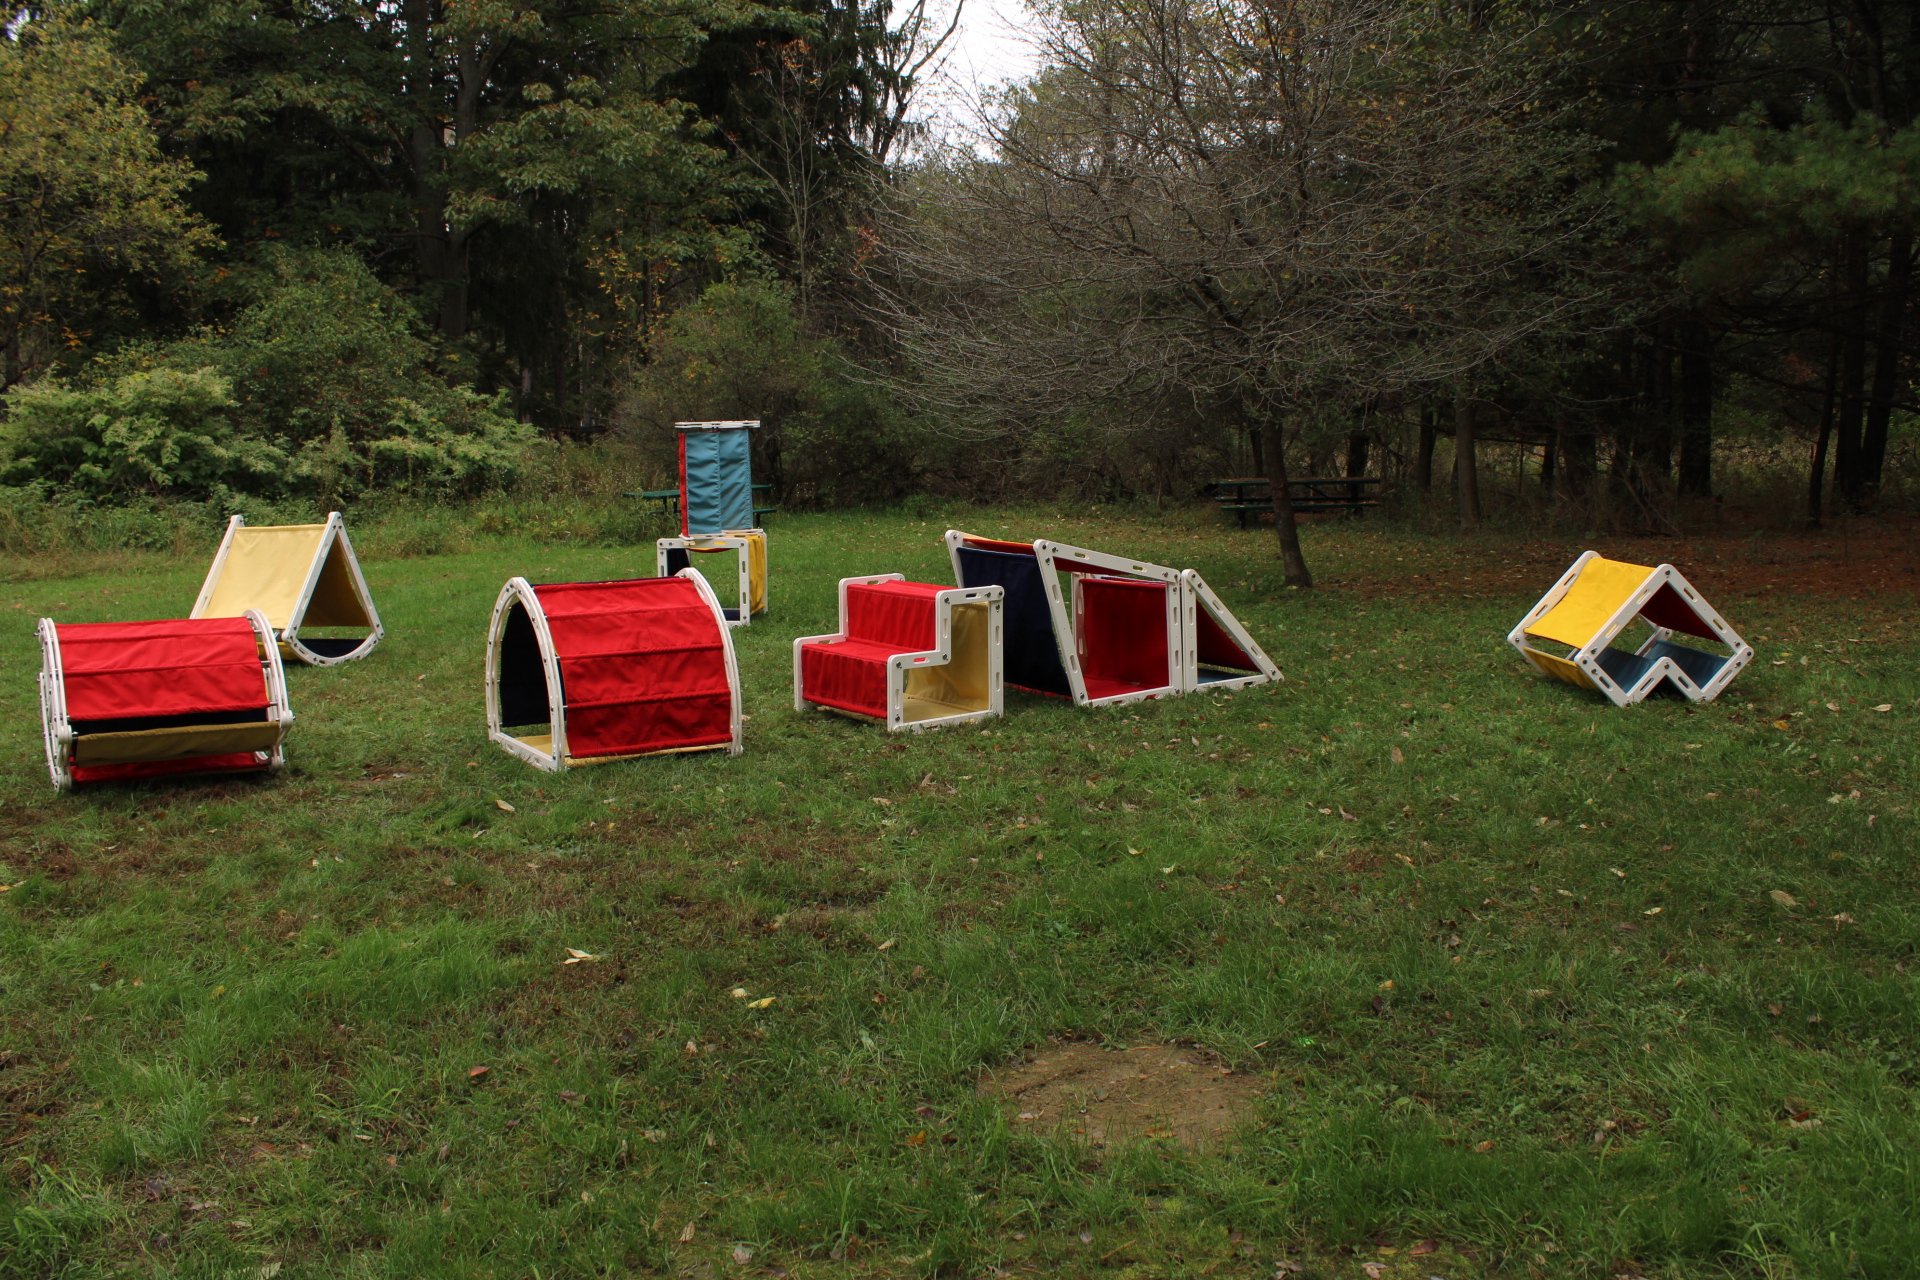
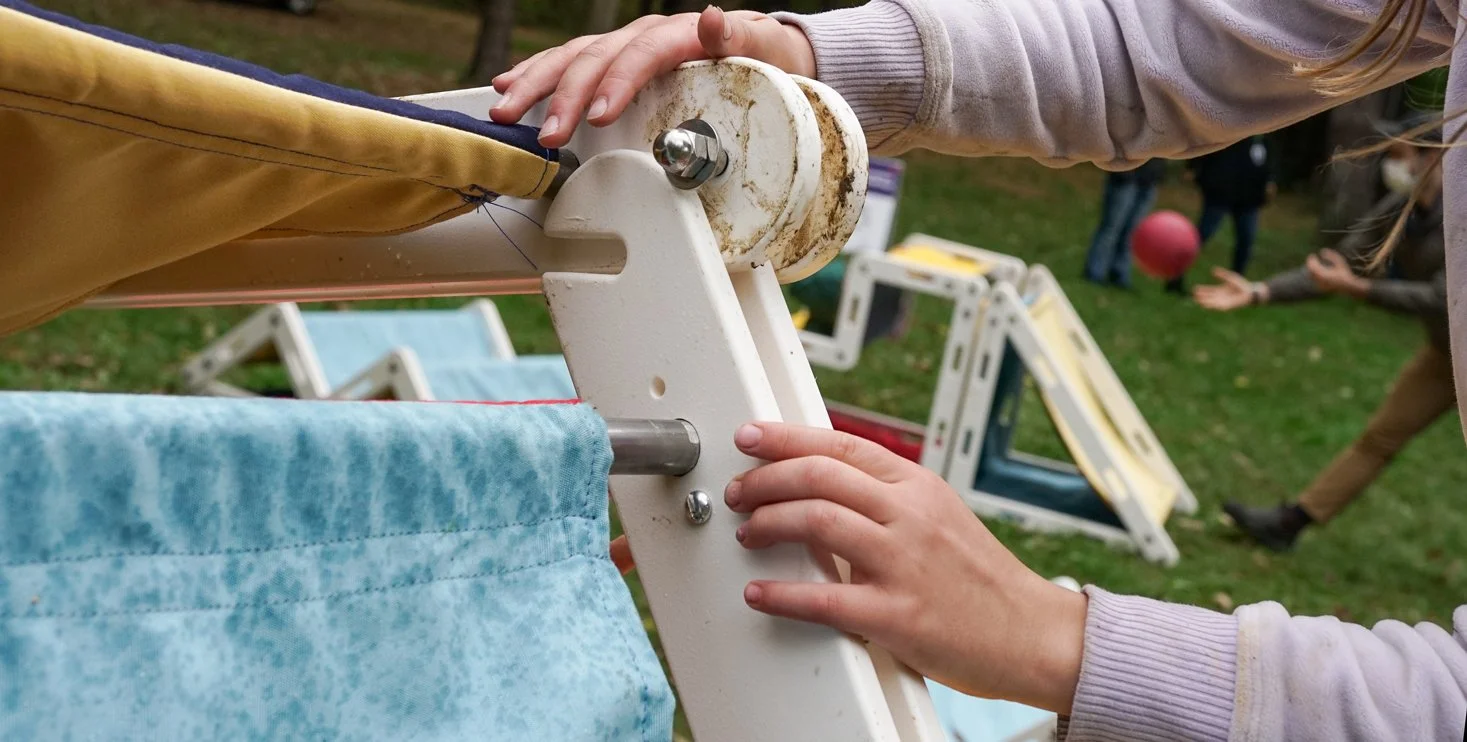
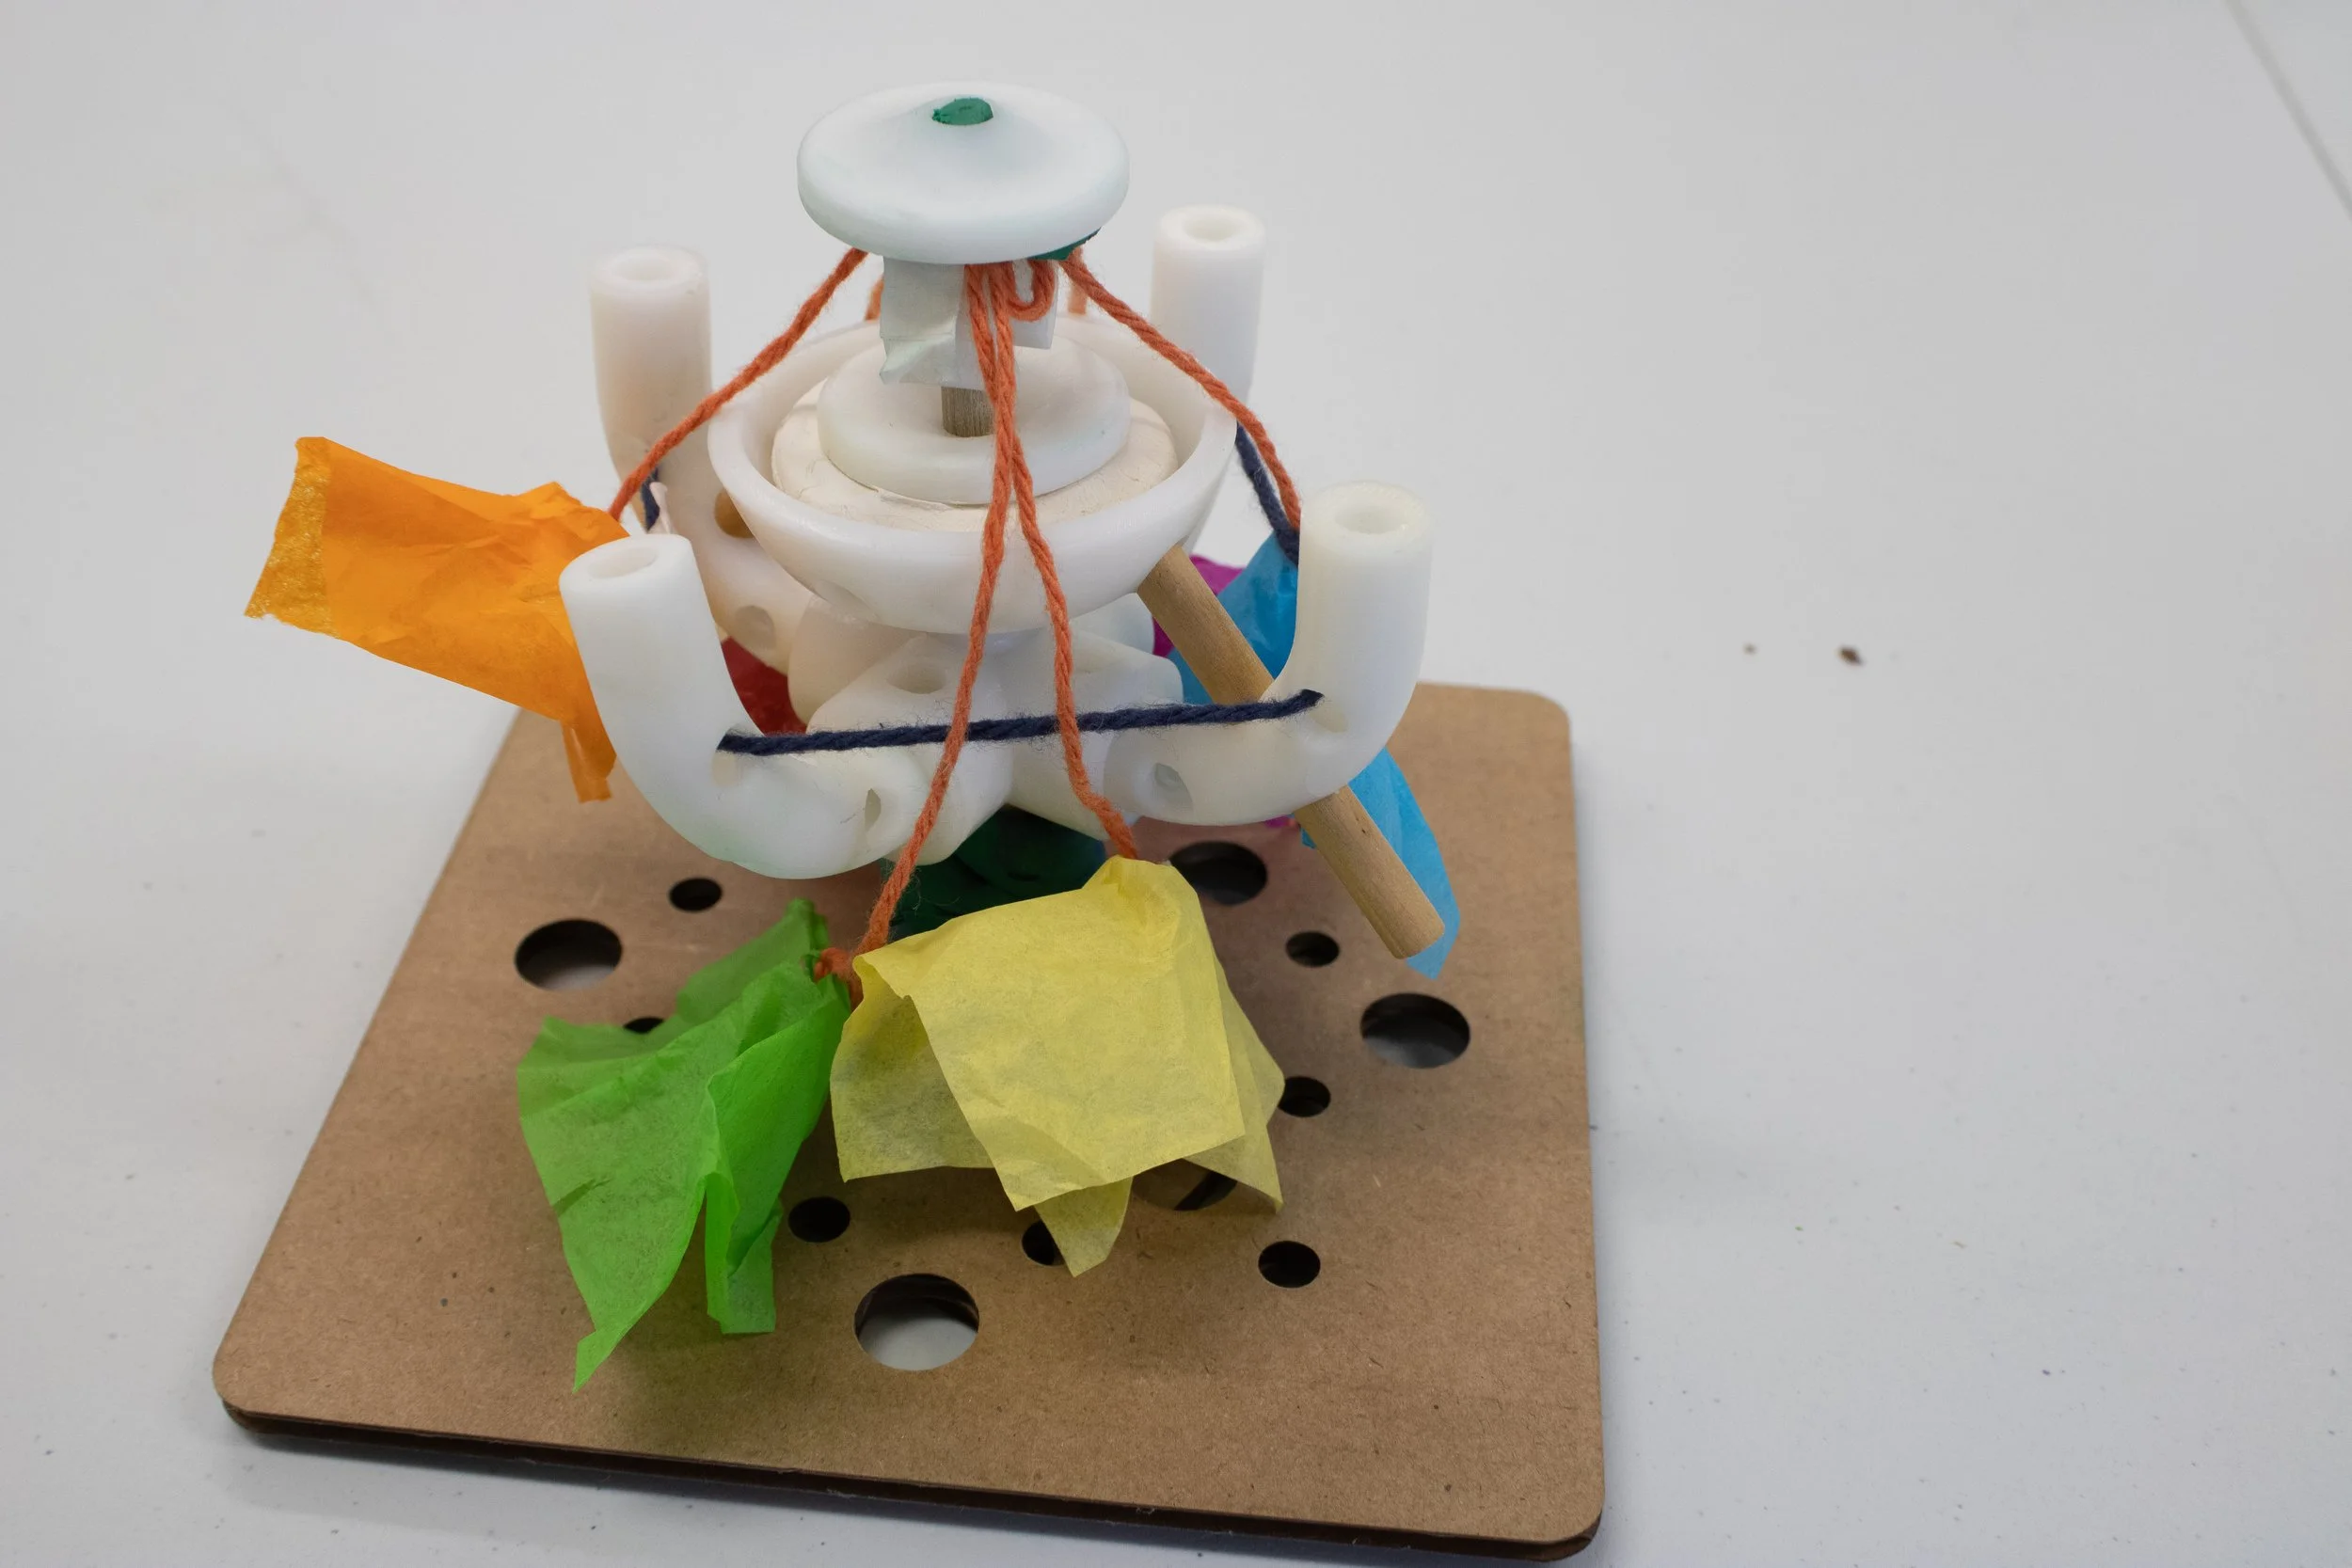
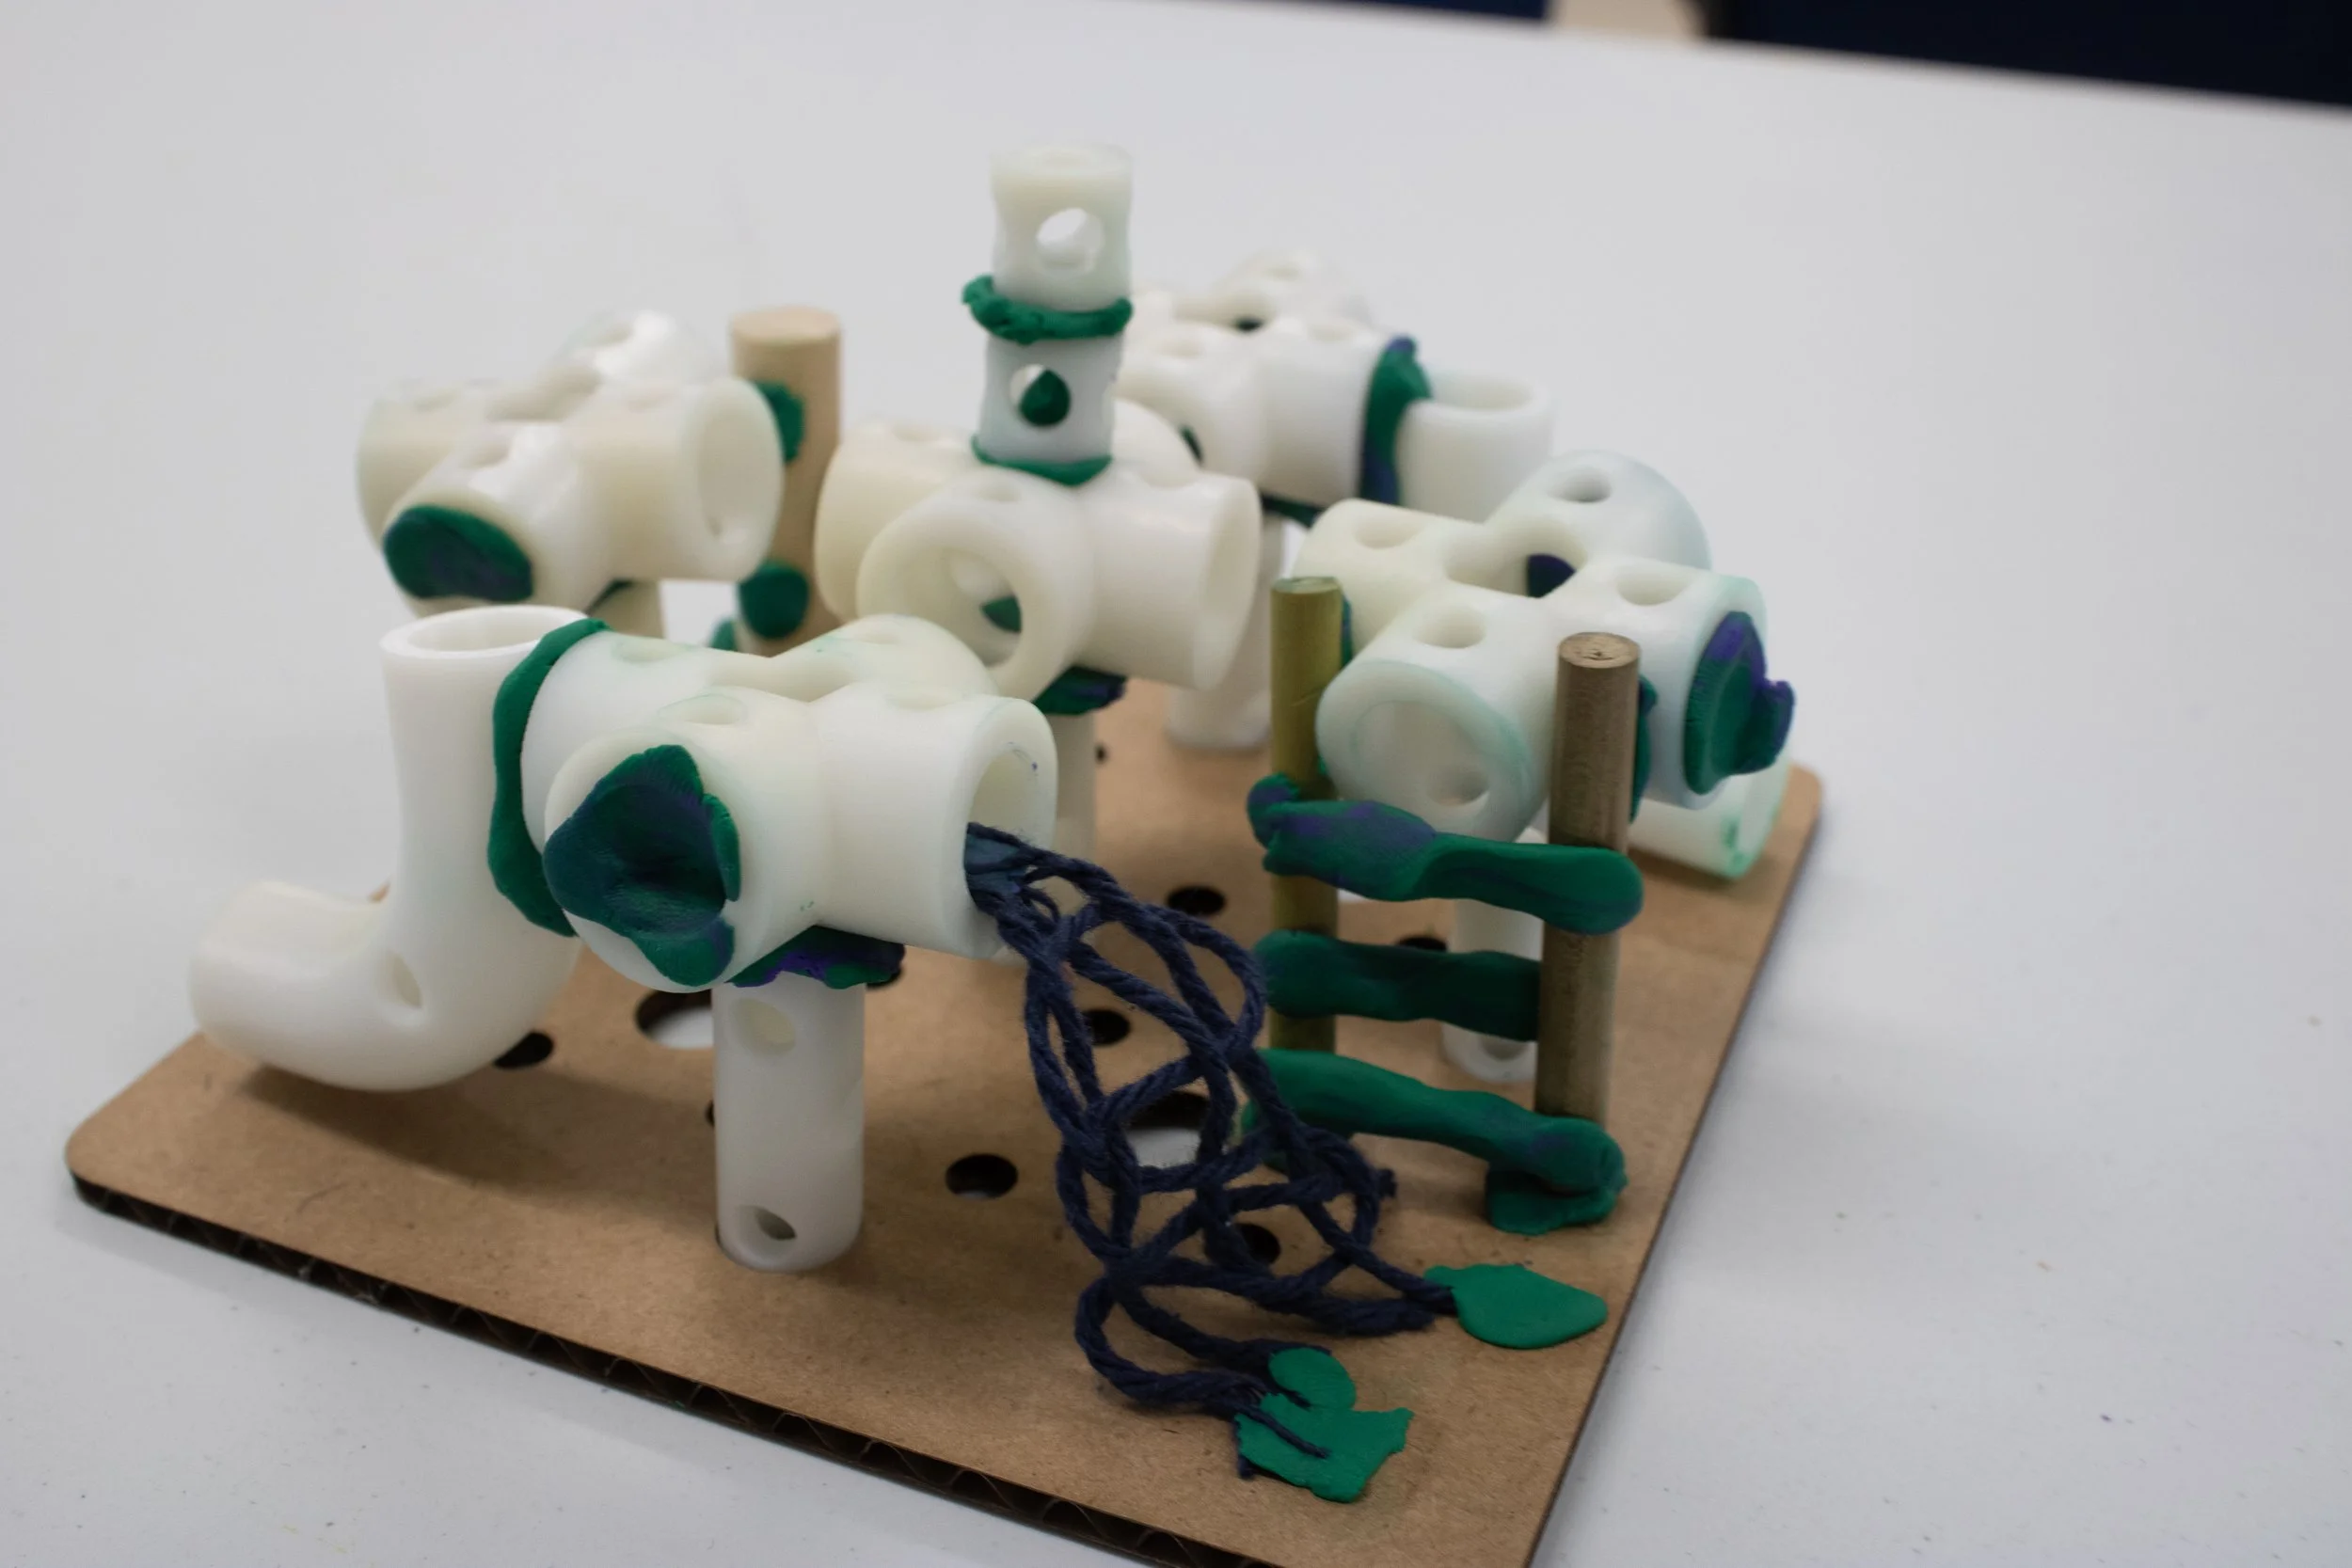
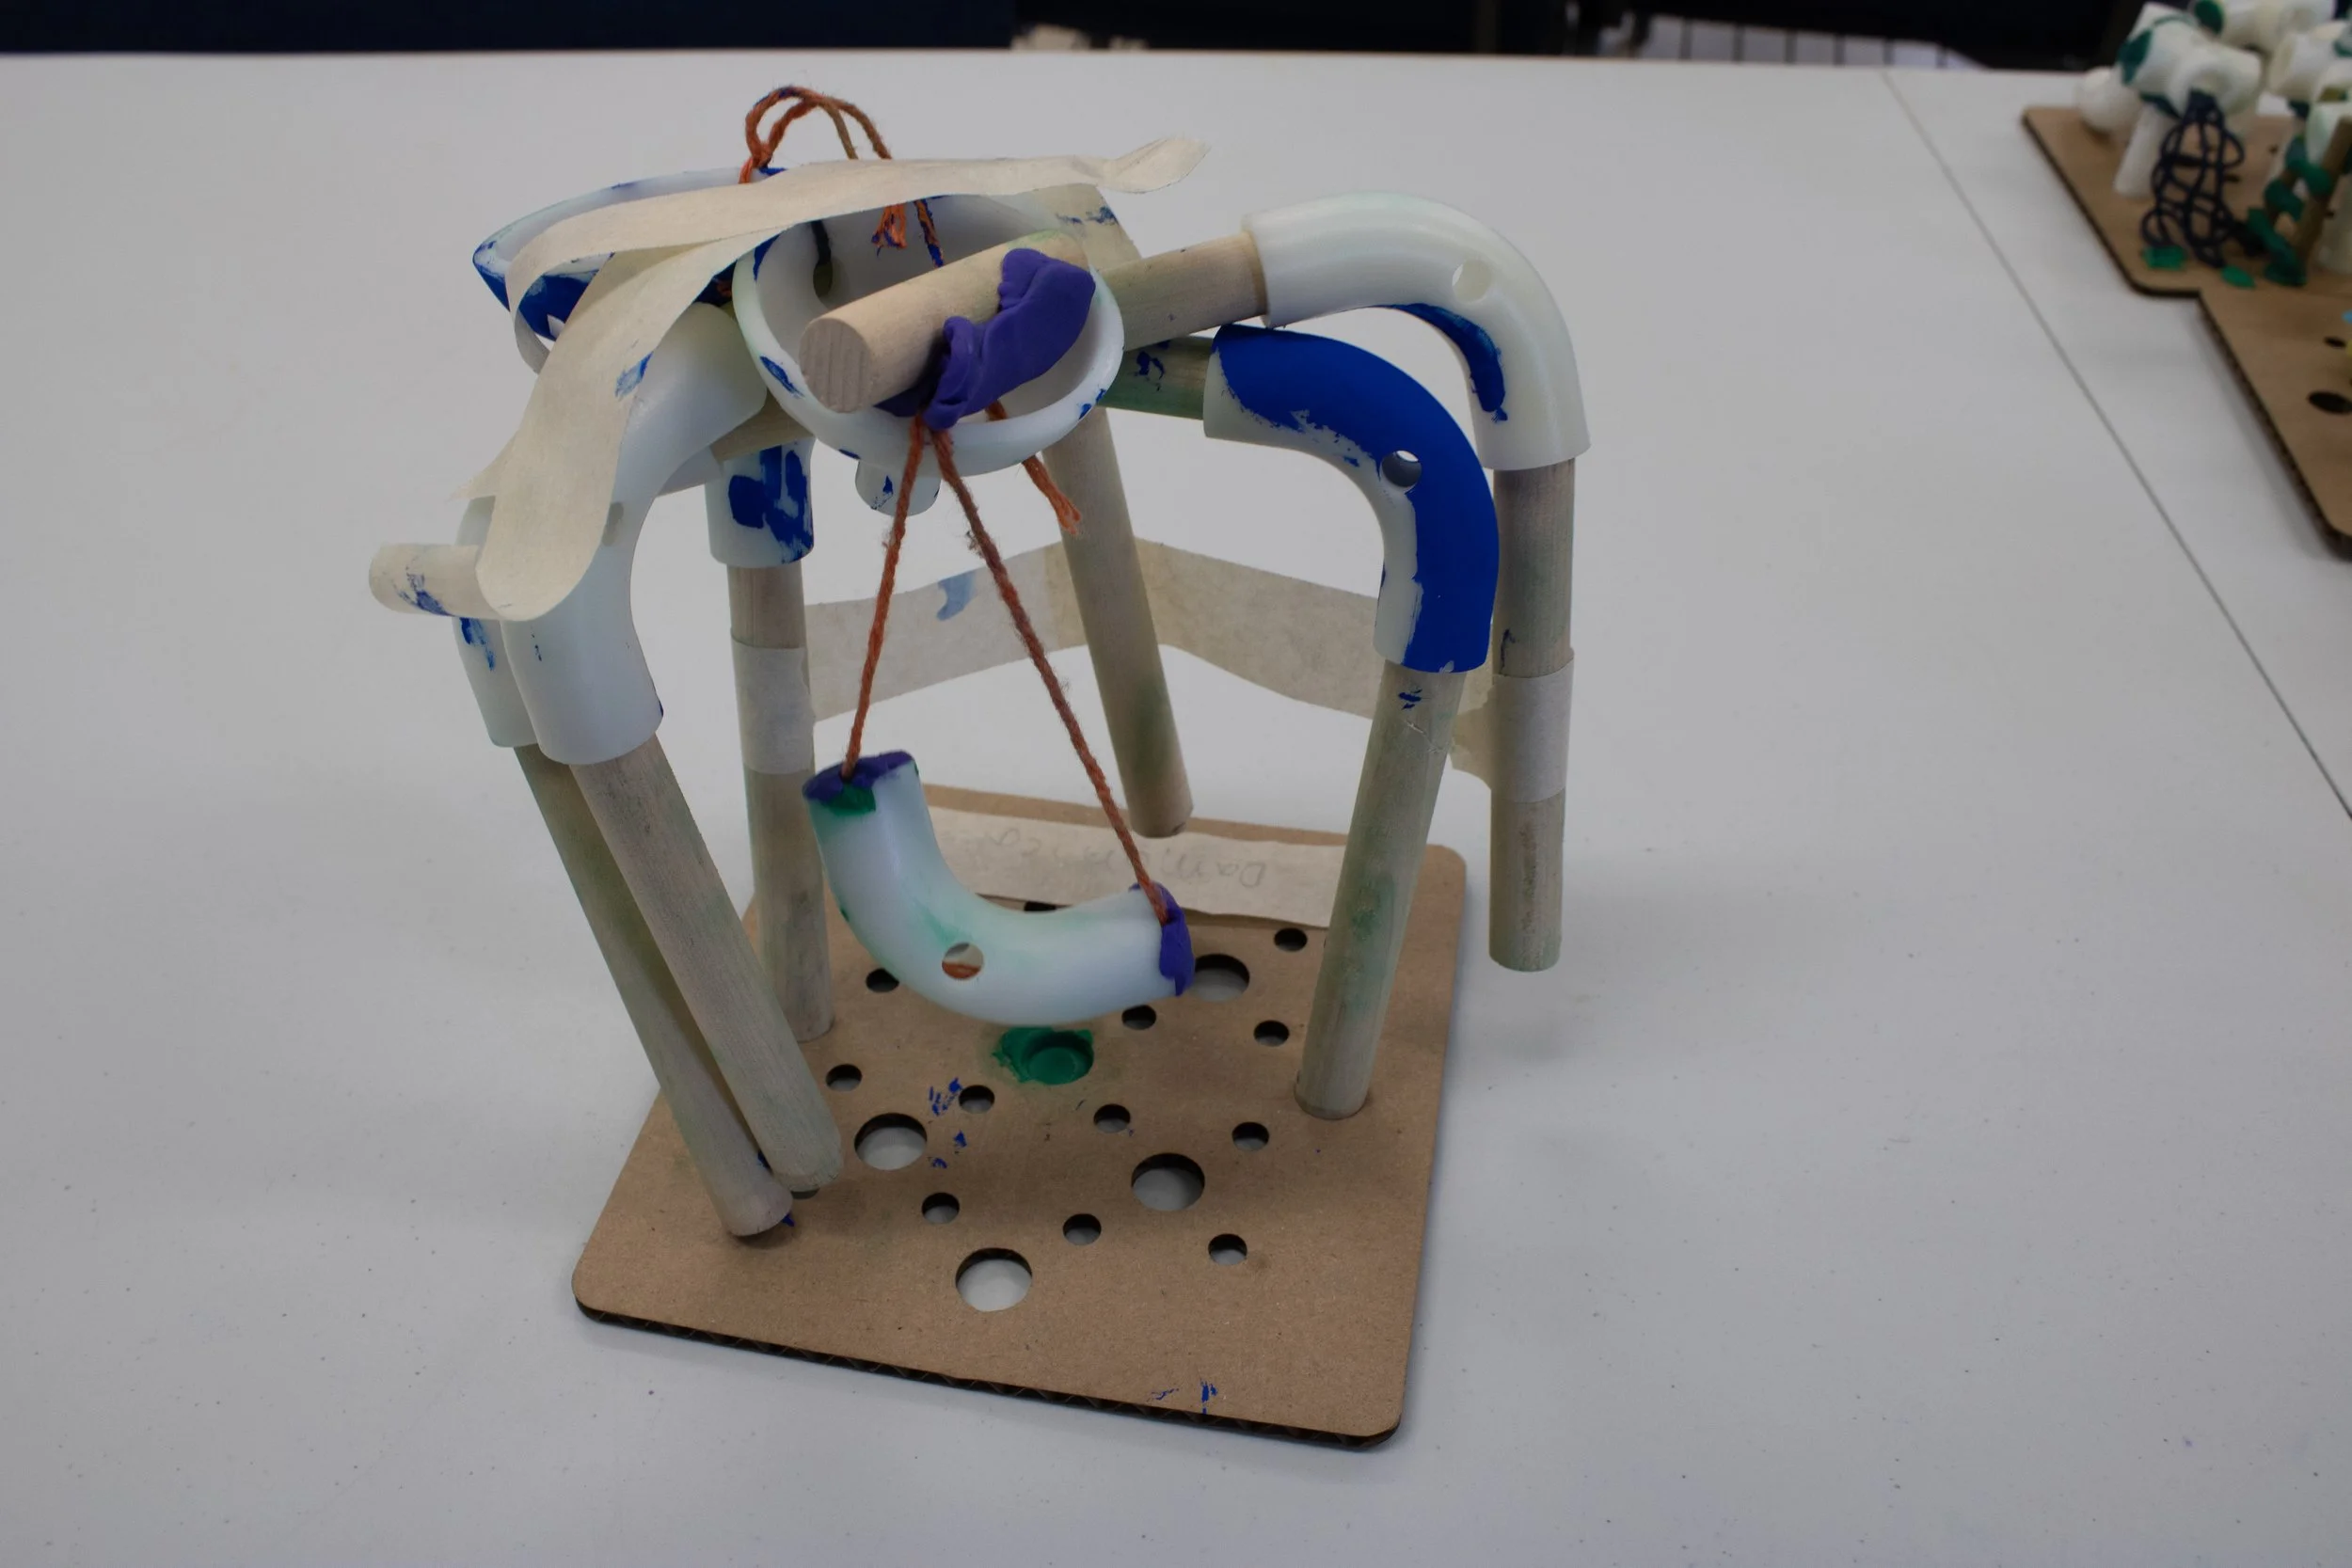
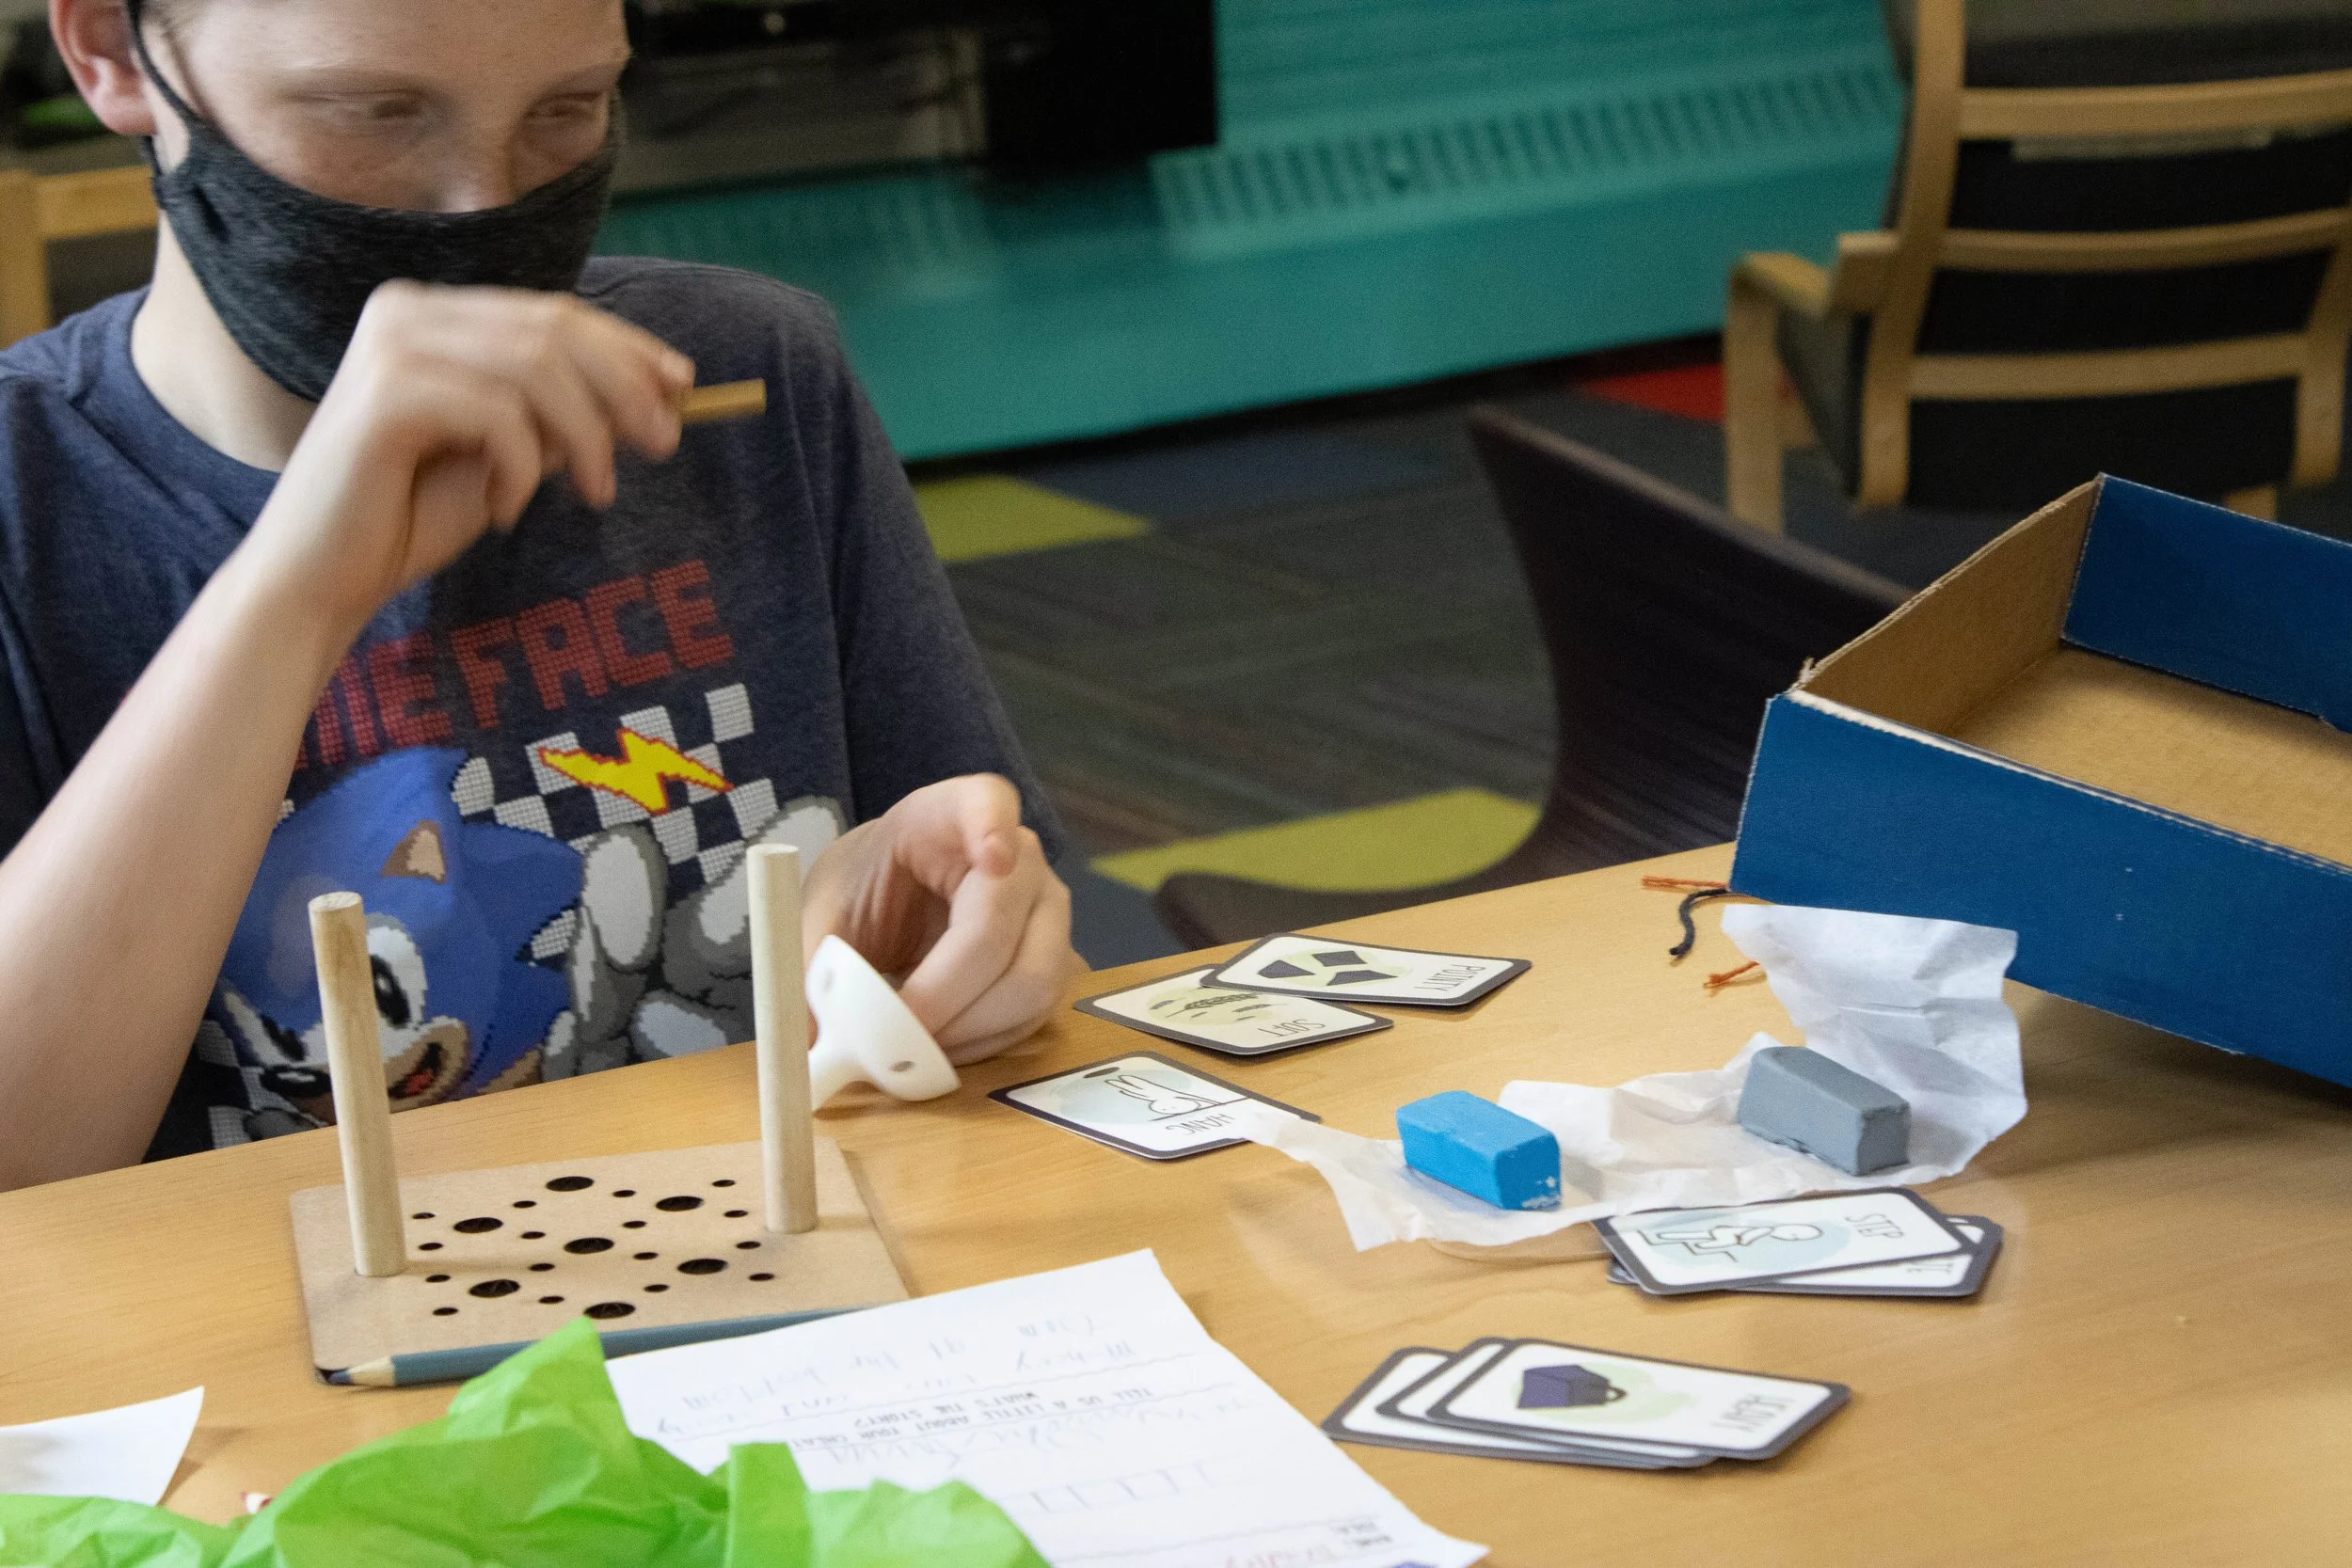
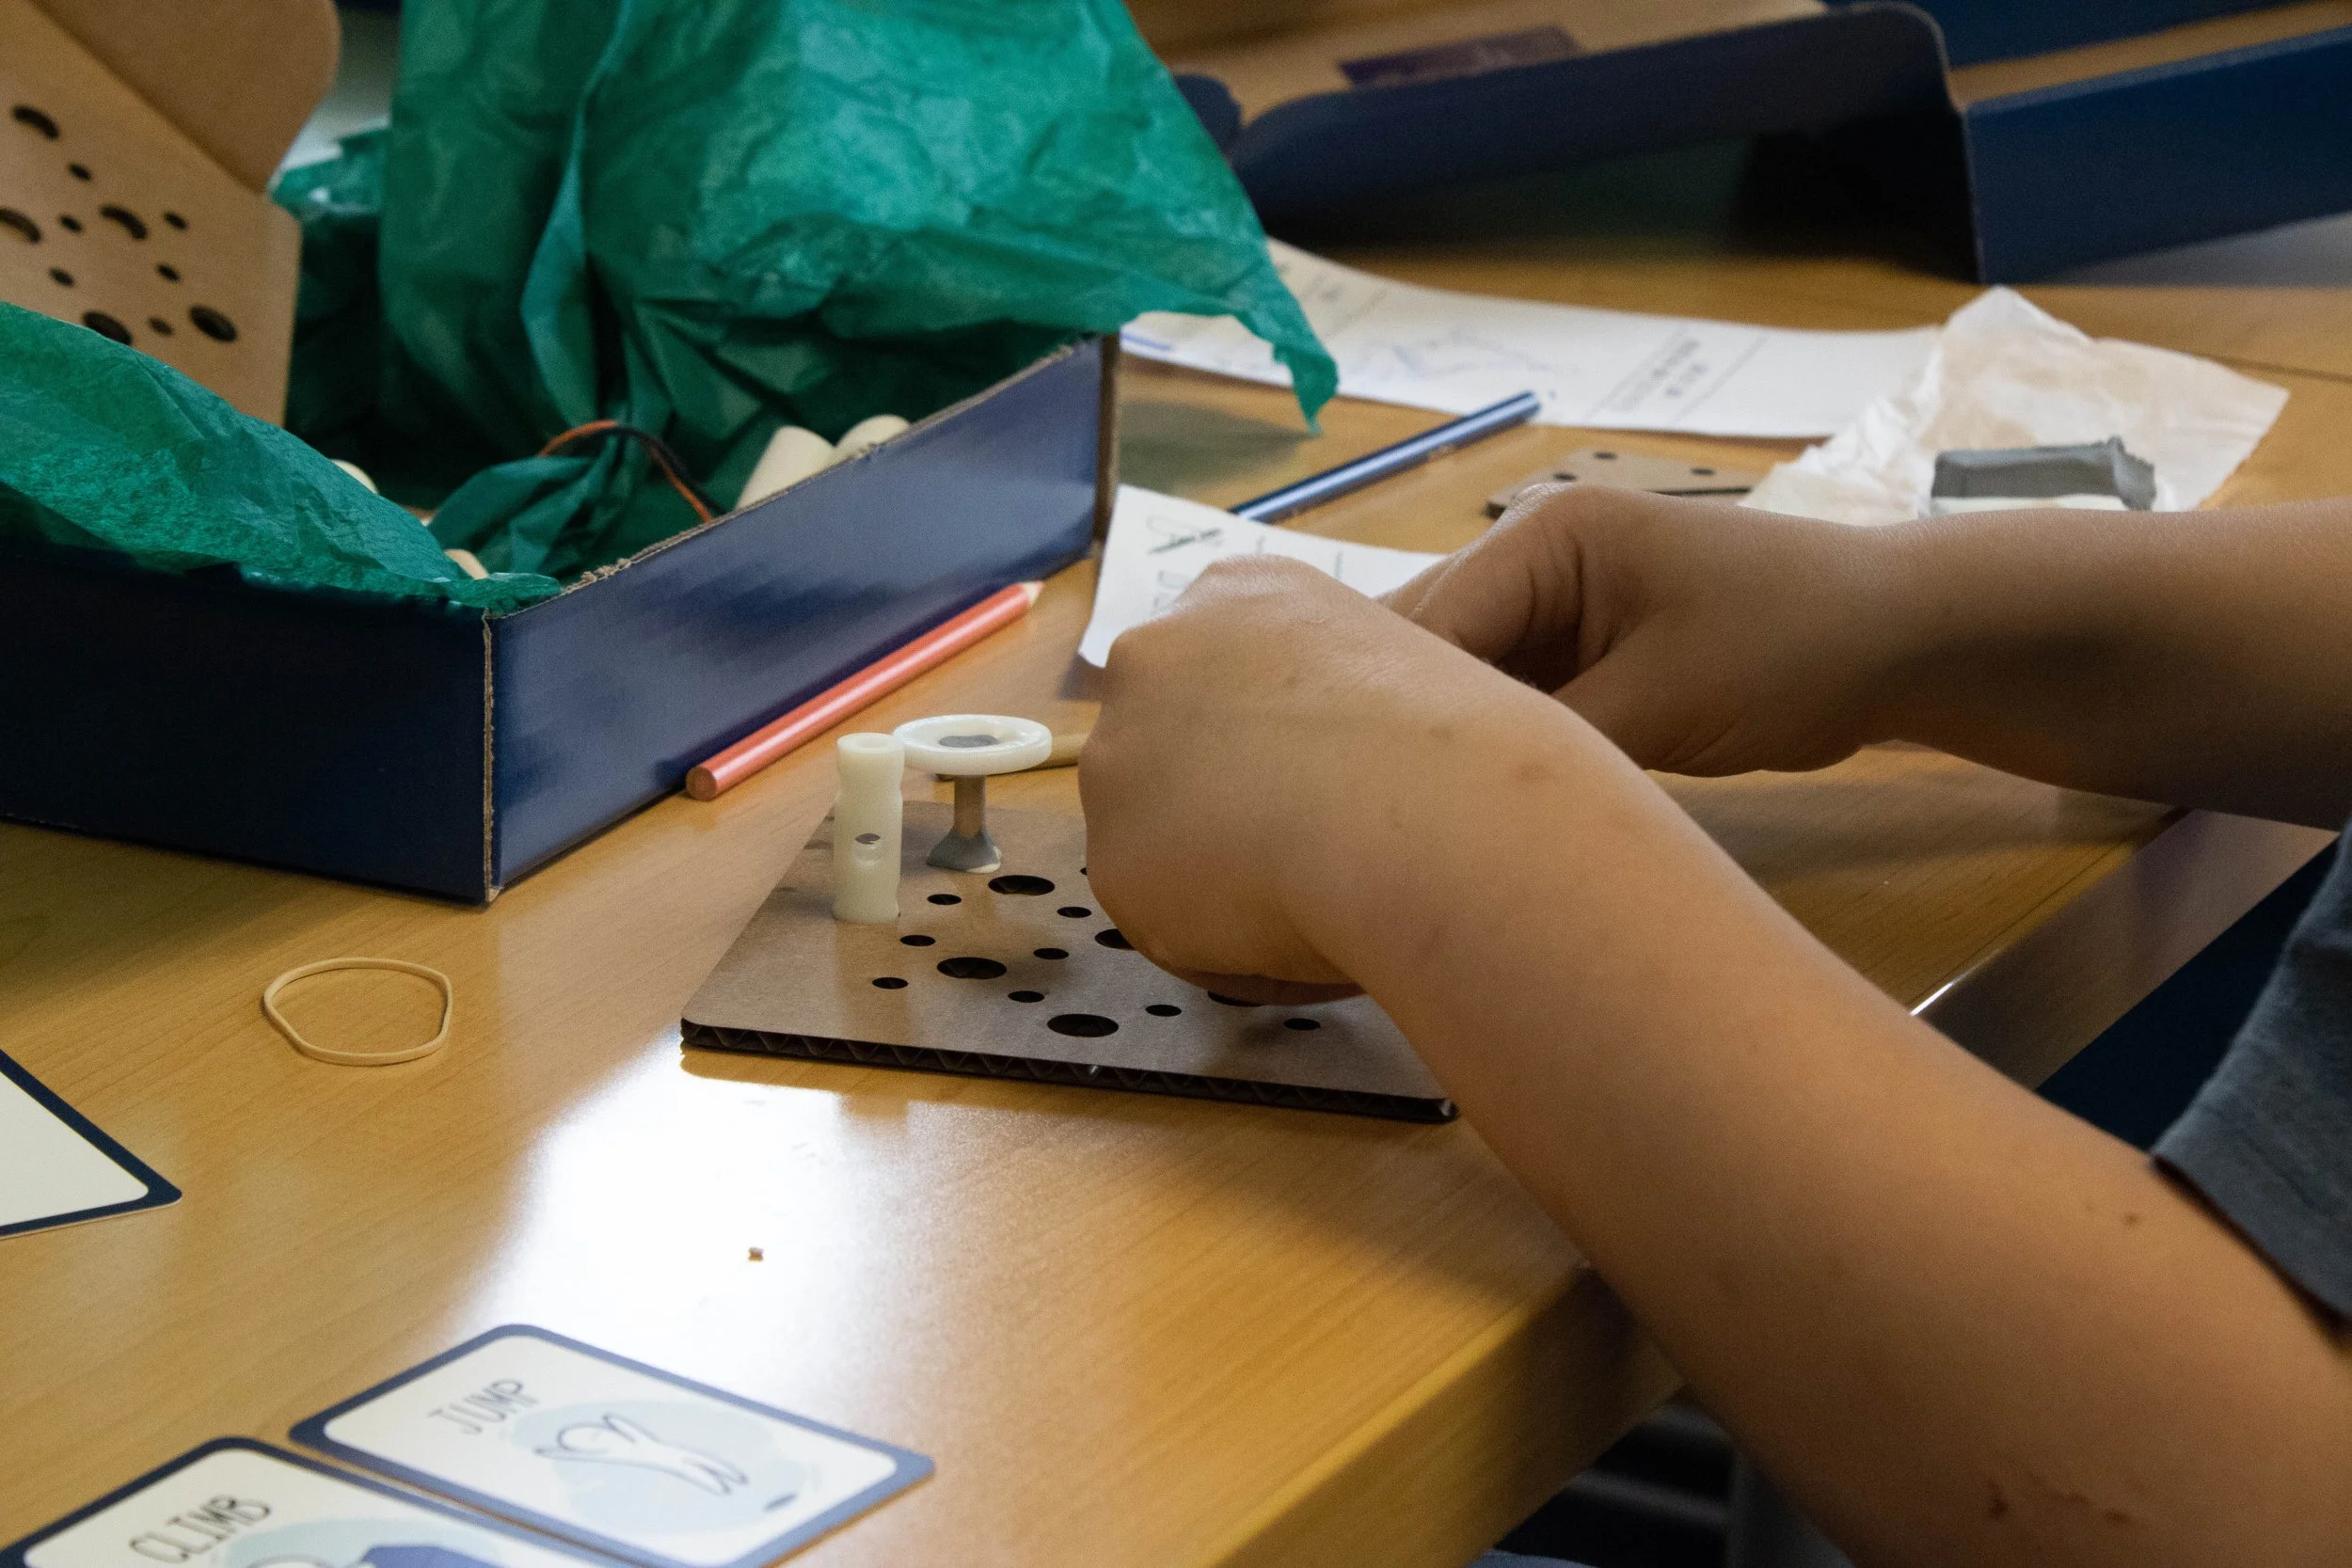
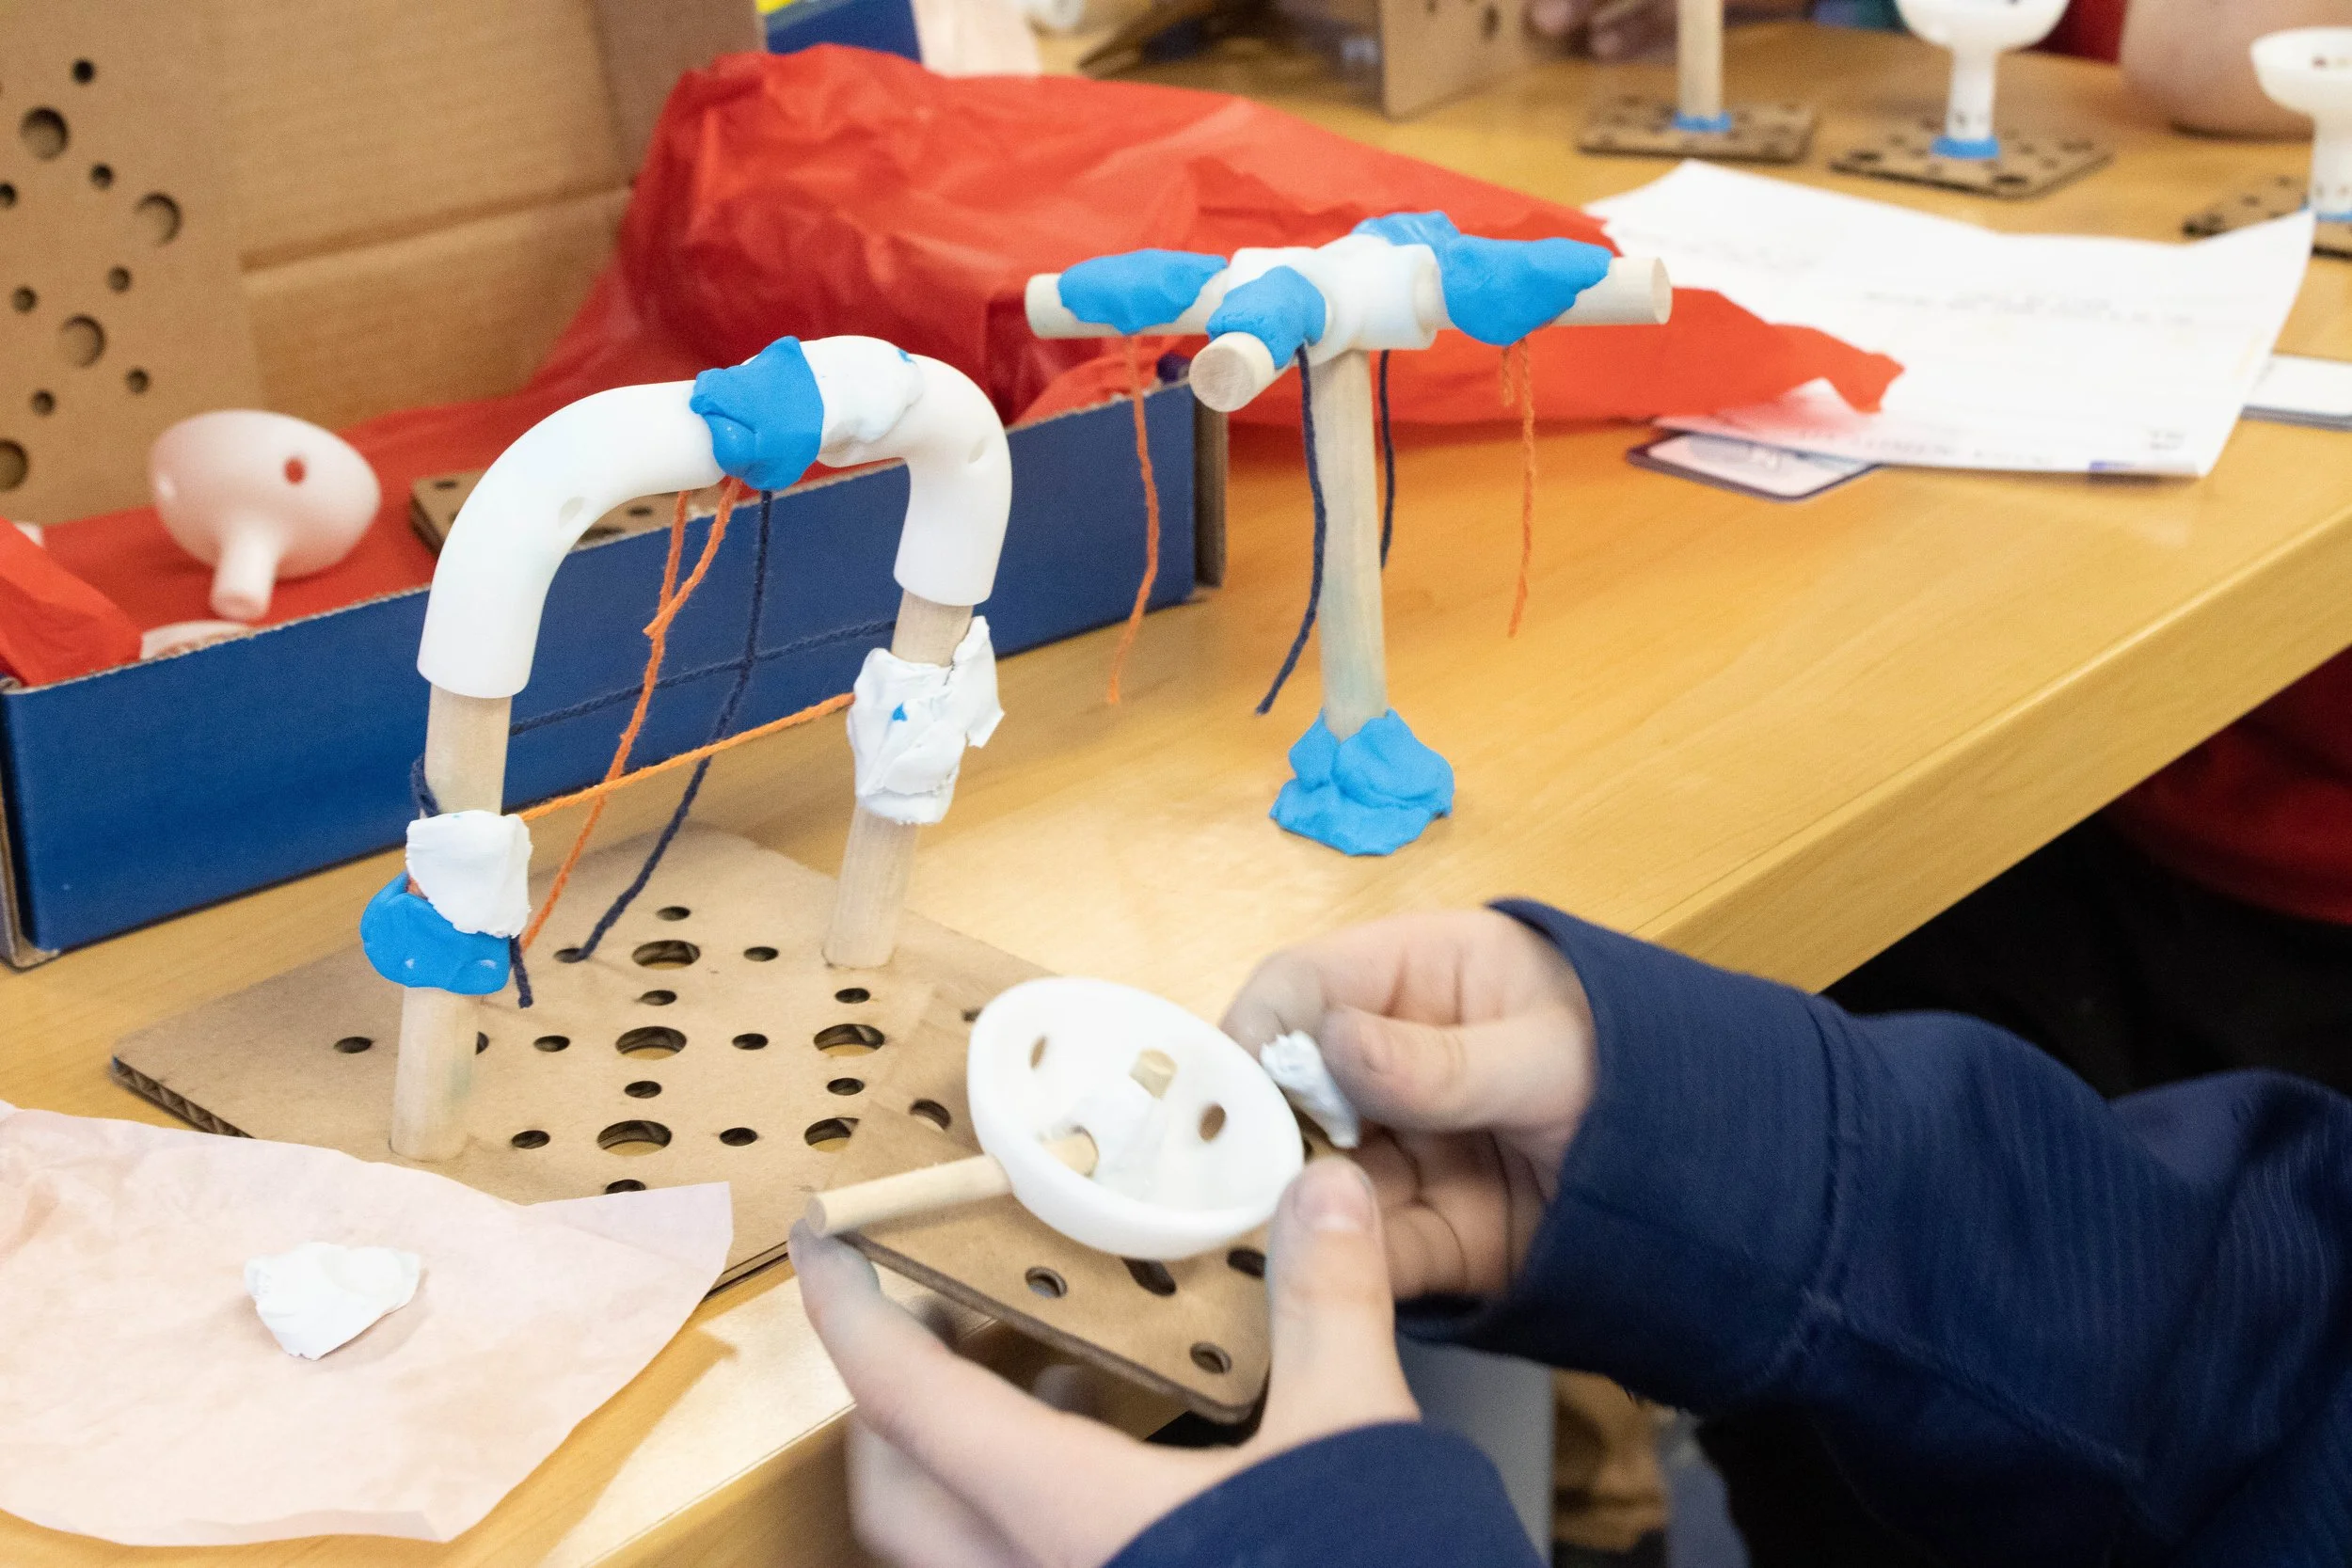
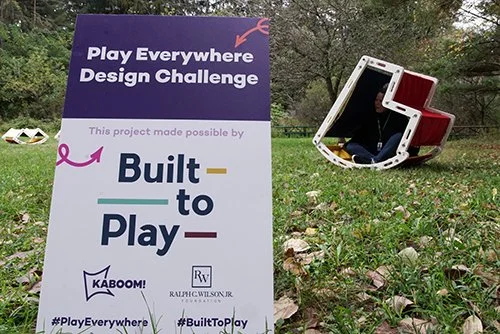
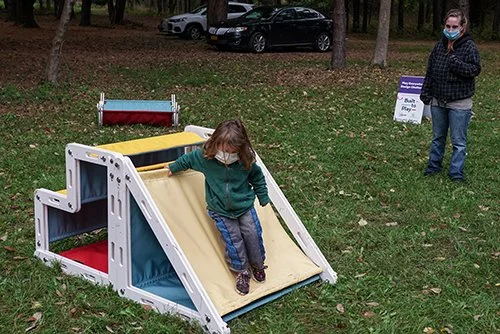
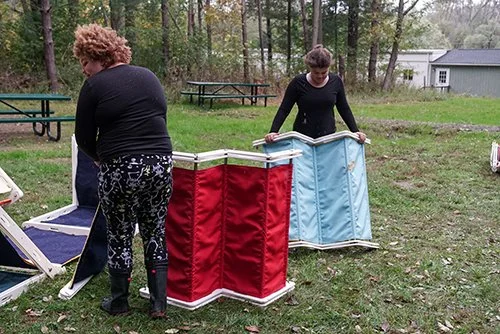
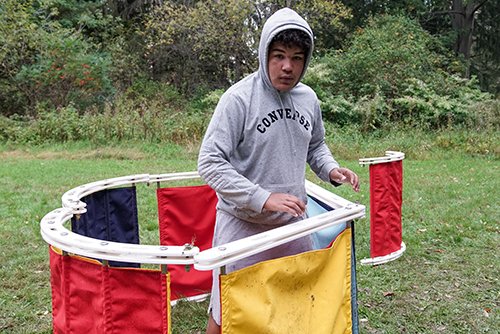
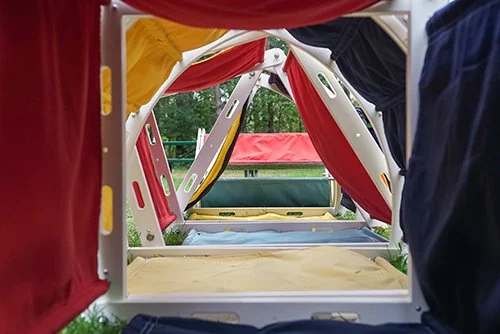
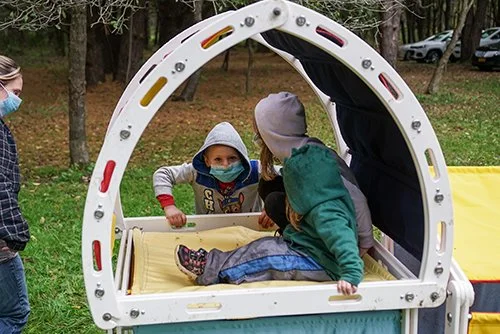
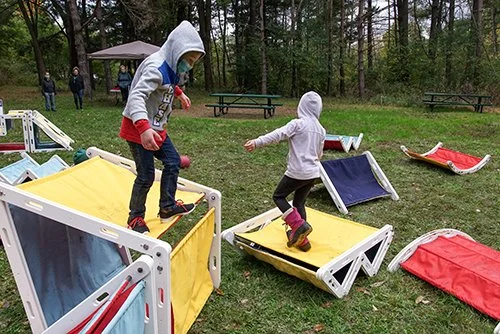
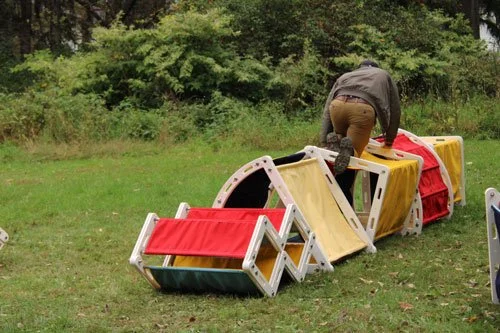
Access to places to play enables communities to have healthier lives and lowers healthcare costs. To address this challenge, KABOOM! and the Ralph C. Wilson Jr. Foundation launched the Play Everywhere Challenge with the design brief to make play more accessible. Our winning concept: the best playground designers are the kids who use them.
WHAT IF KIDS DESIGNED THEIr OWN PLAYGROUND?
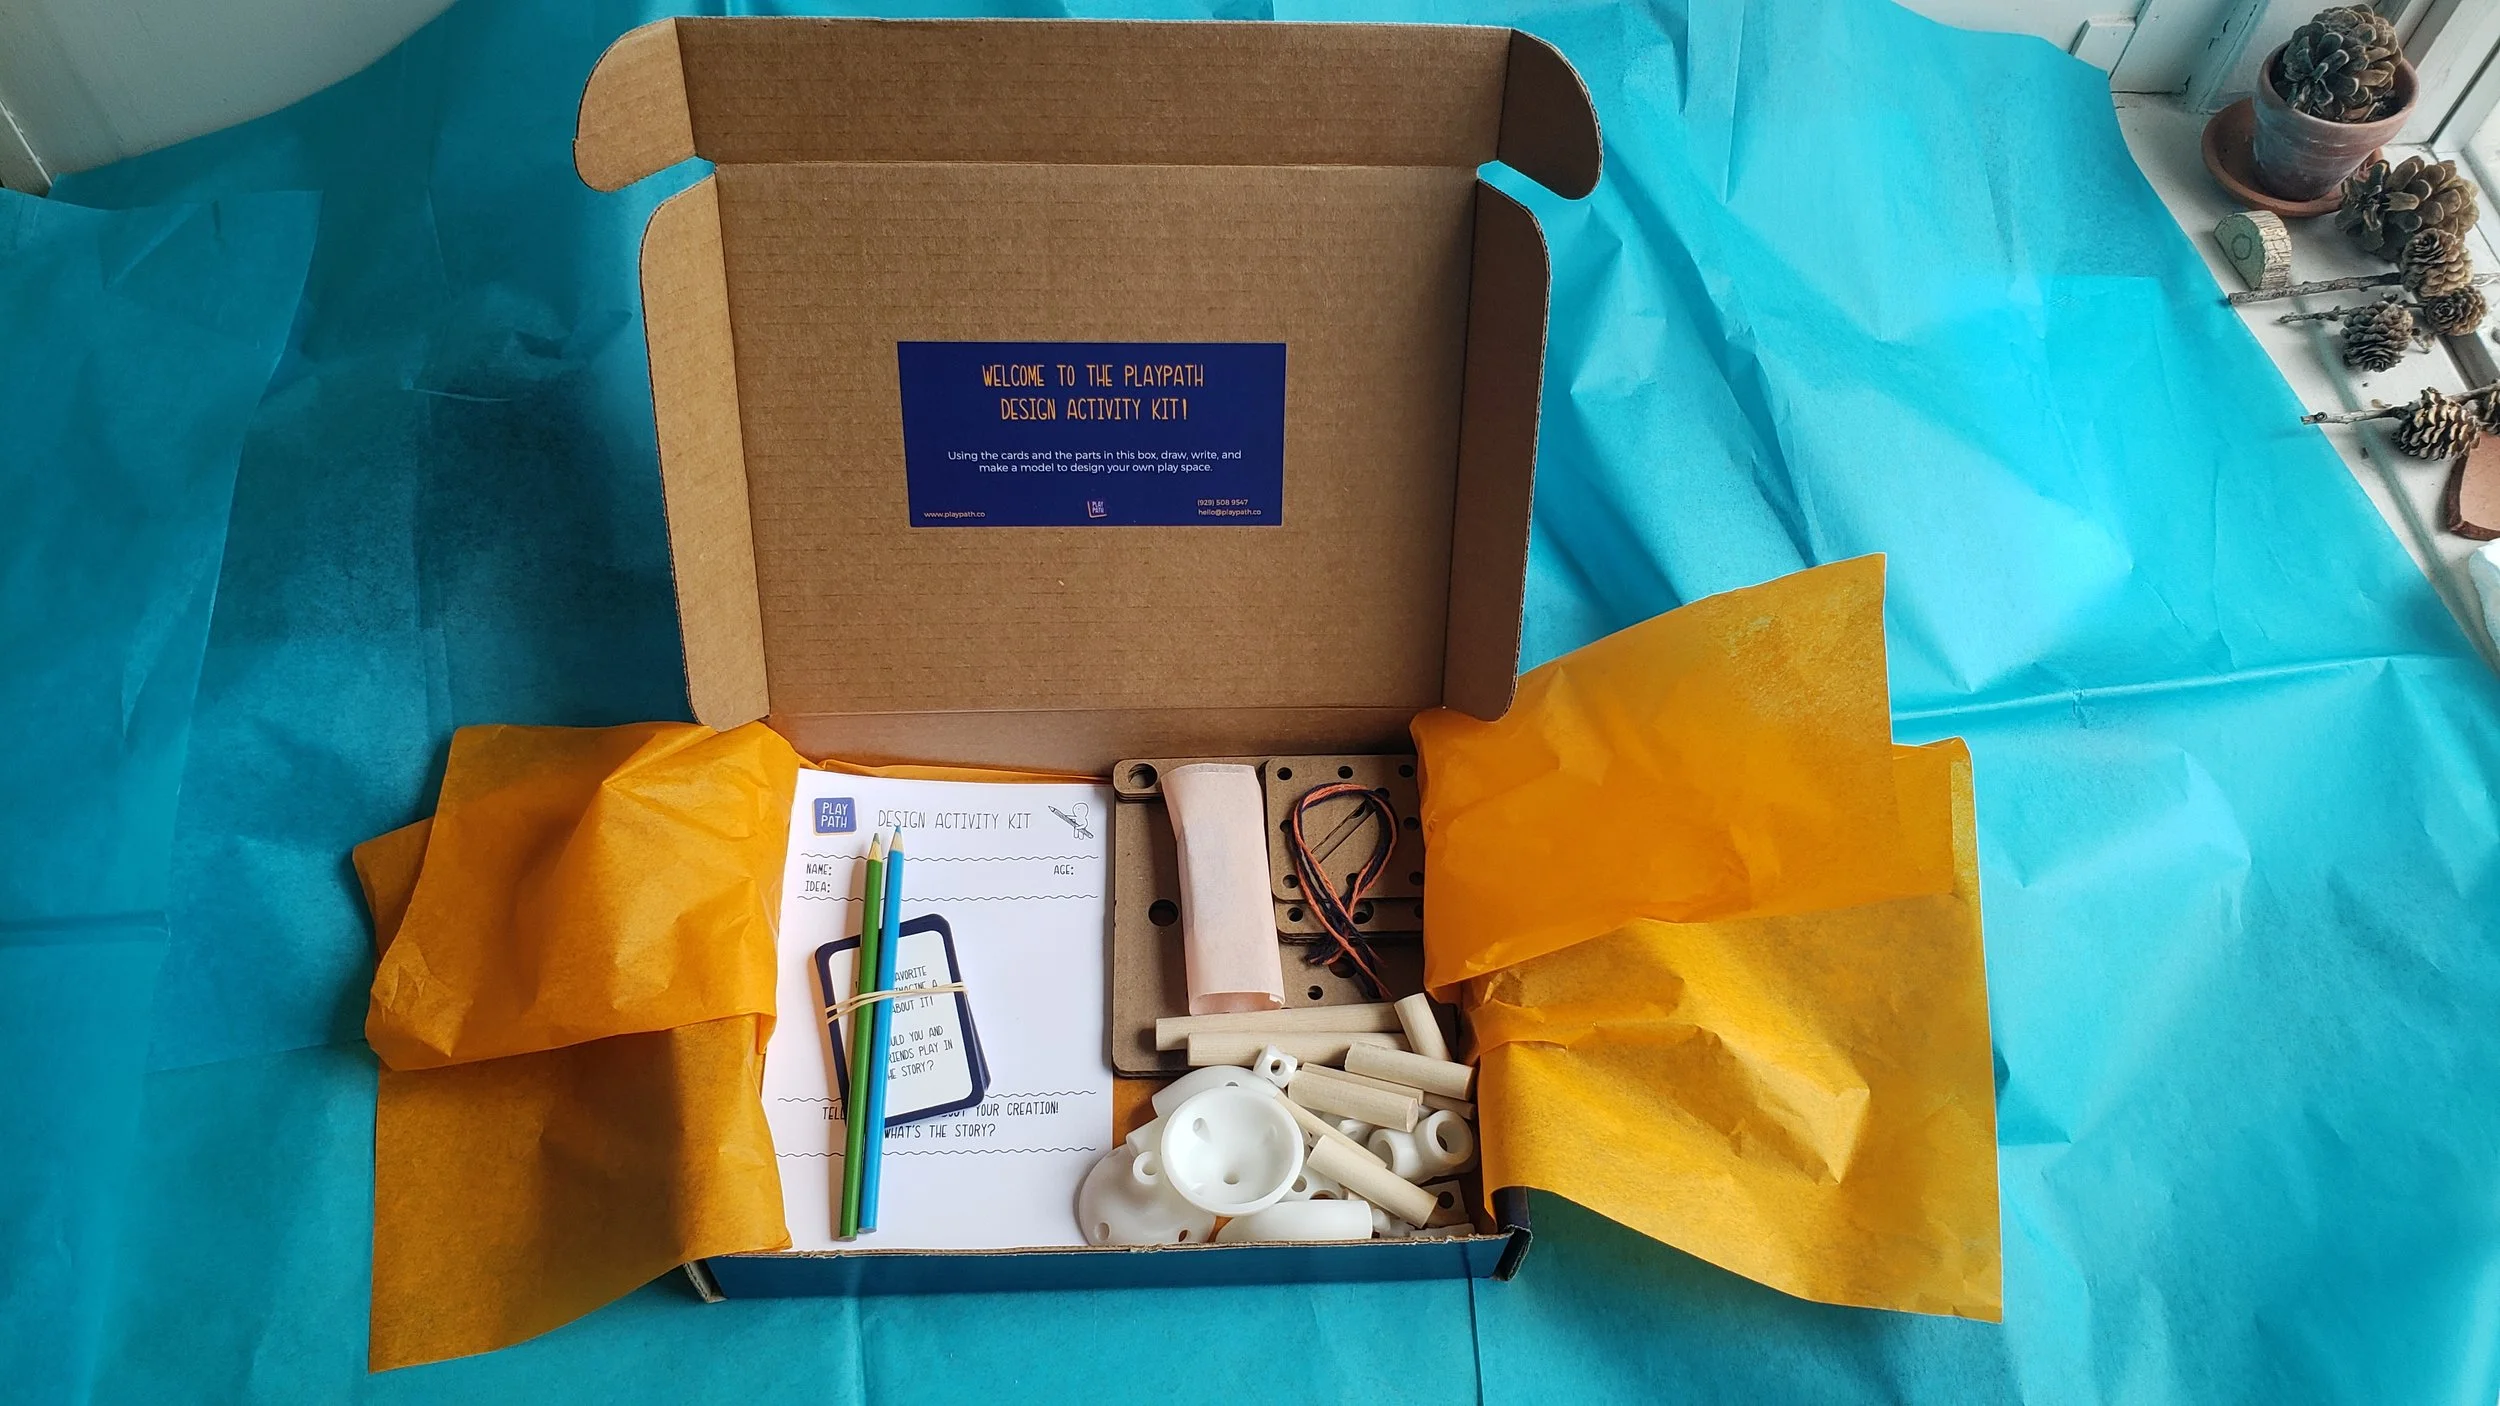
We created gamified “design workshops in a box” mailing kits to over 60 local families. After prototyping together in social pods and over Zoom and generating some wild ideas - our team refined them for production. The Play Path now lives in East Aurora, NY.

PROJECT
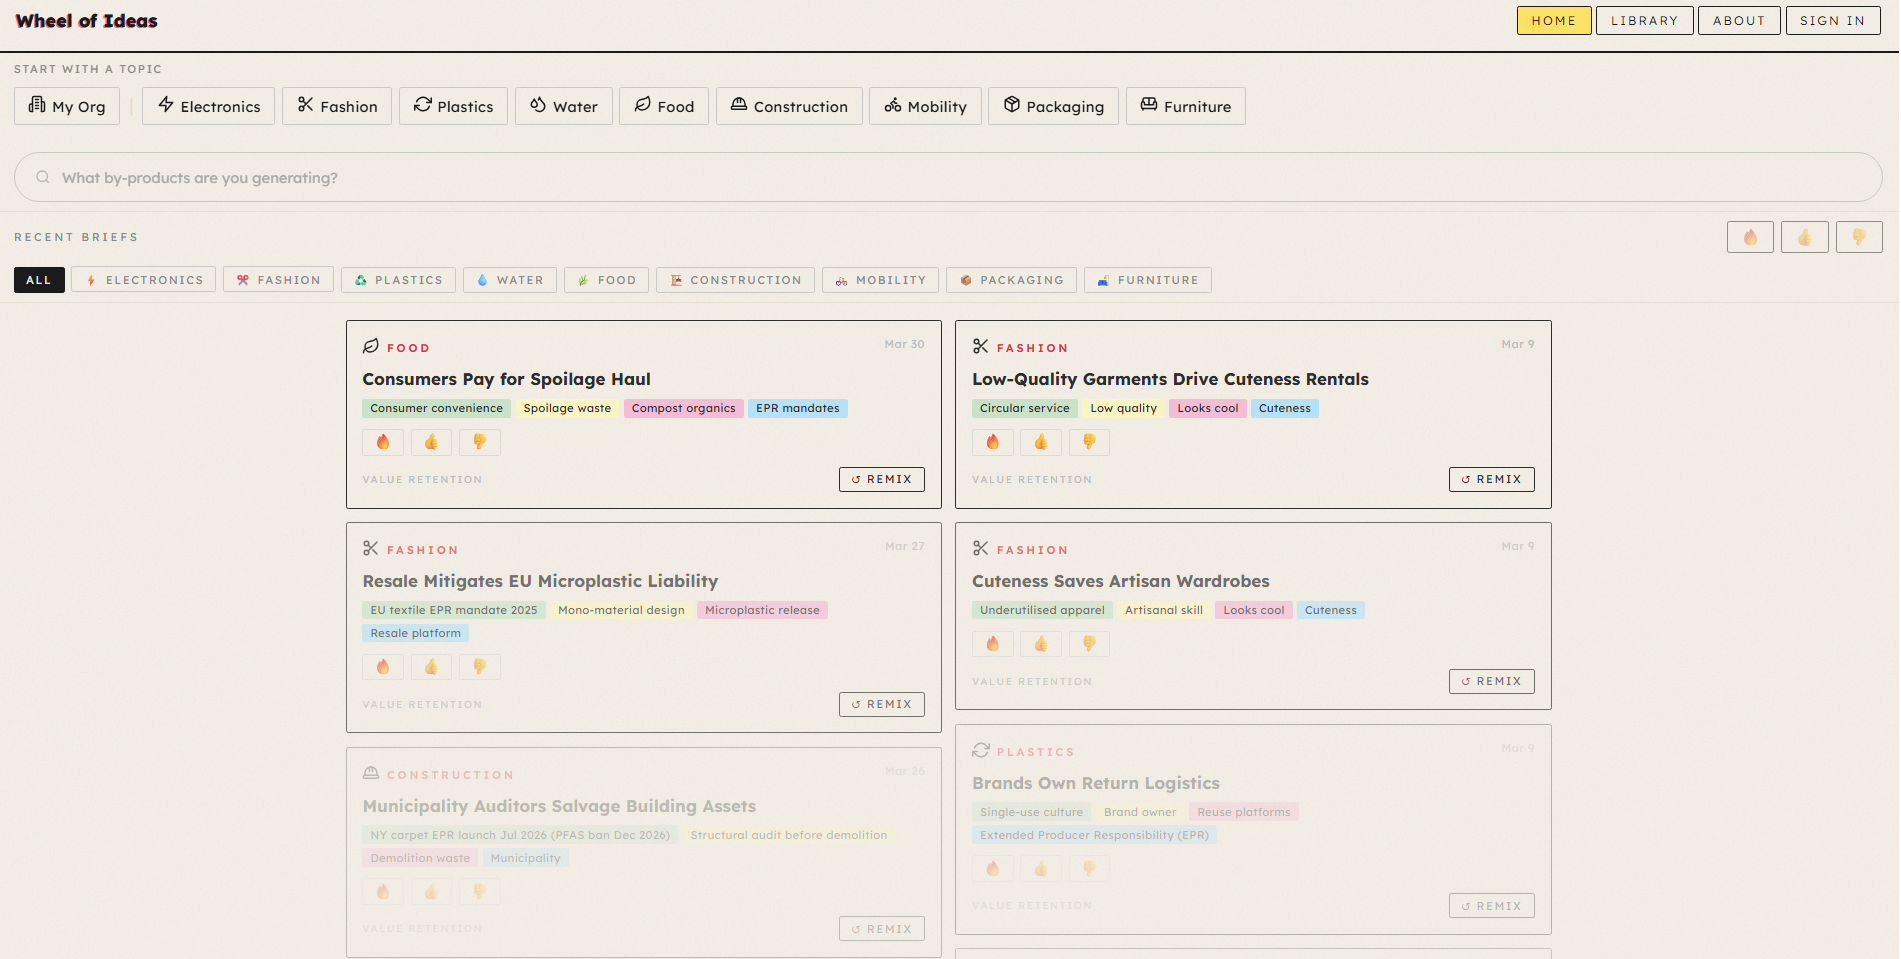
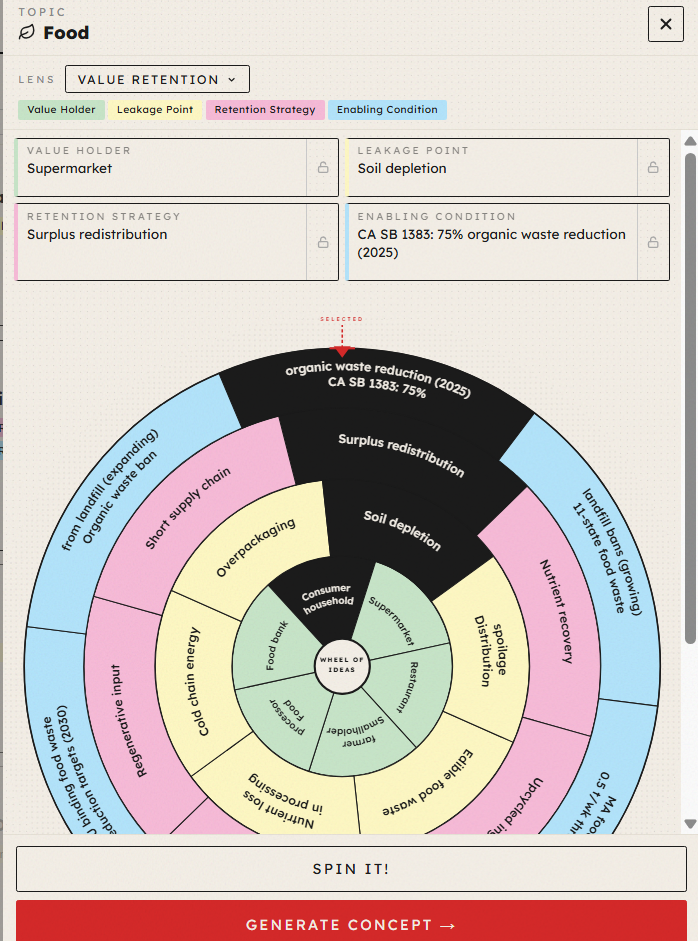
WHeel of ideas
Digital tool · 2025
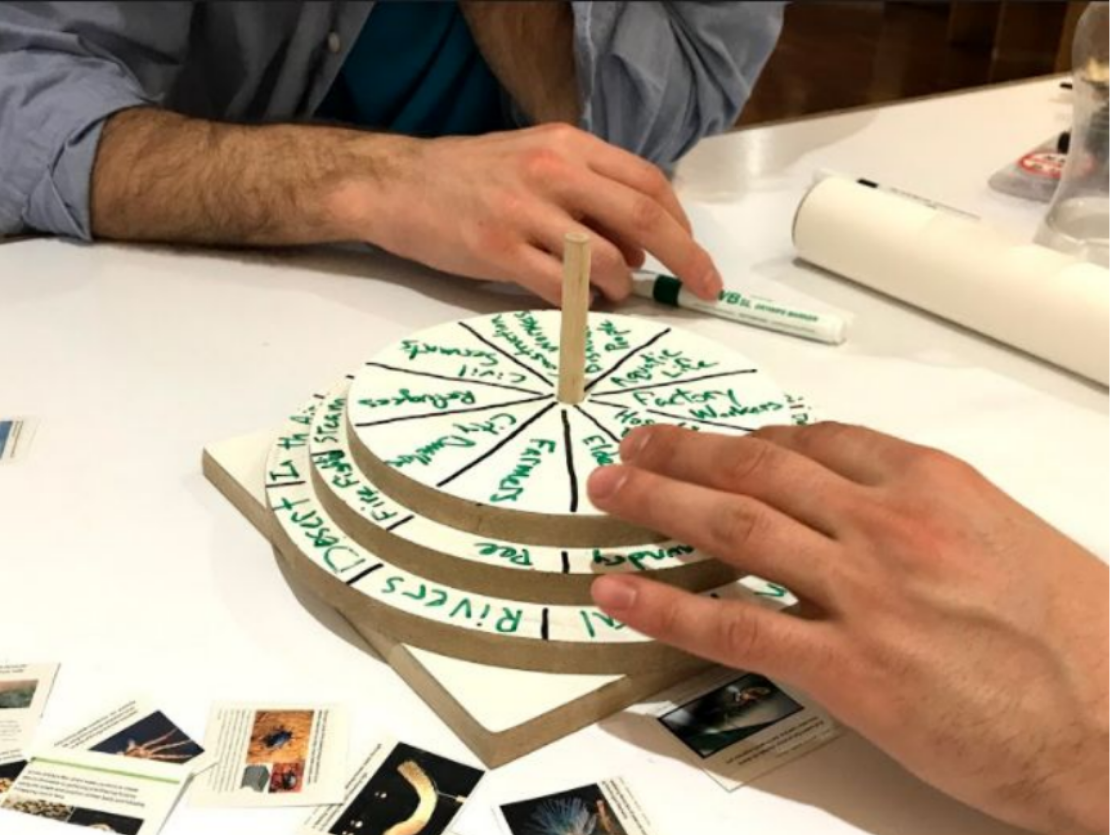
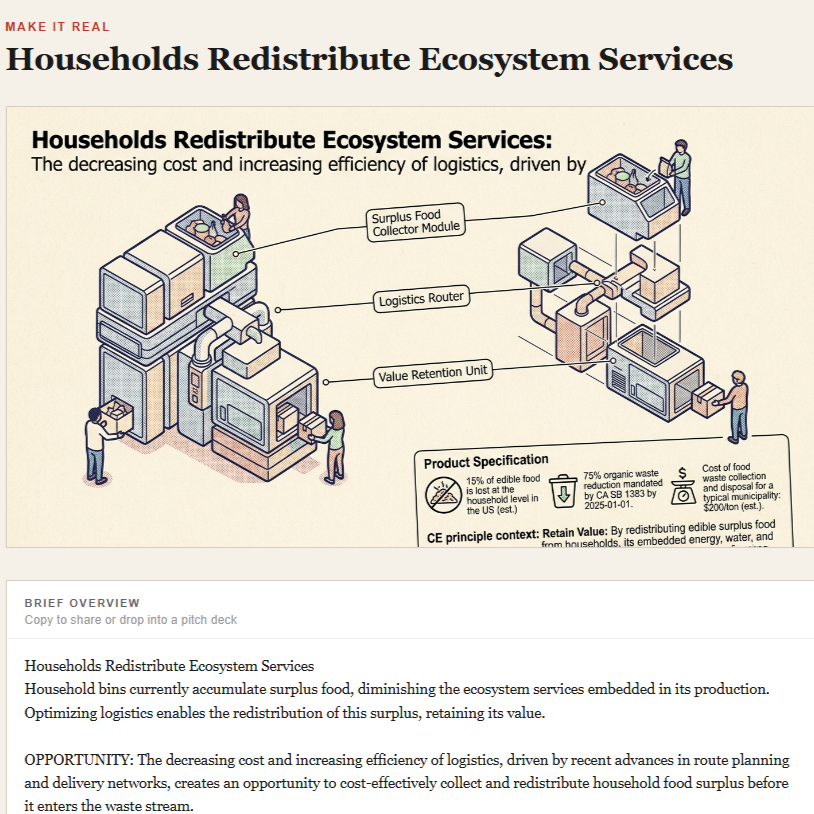
WHAT IF THERE WAS a business IDEA GENERATOR for the CIRCULAR ECONOMY?
While at the Royal College of Art, Kenny researched tools for creativity and the Wheel of Ideas was born. Initially conceived as a physical morphological analysis made from discs of melamine, its now been digitized and turned into an AI design and business concept generator for the circular economy.
PROJECT
ATLAS CIRCULAR
Digital tool · 2022
WHAT IF you mapped places to reuse, repair, Resell, and Regenerate?
The circular economy can feel abstract — a systems-level concept disconnected from daily life. But repair shops, tool libraries, refill stations, and material exchanges already exist in most communities. They're just invisible.
Starting with NYC, Atlas Circular is an open-source map that makes locally available circular resources findable — places to repair, reuse, upcycle, and shop zero-waste near you.
PROJECT
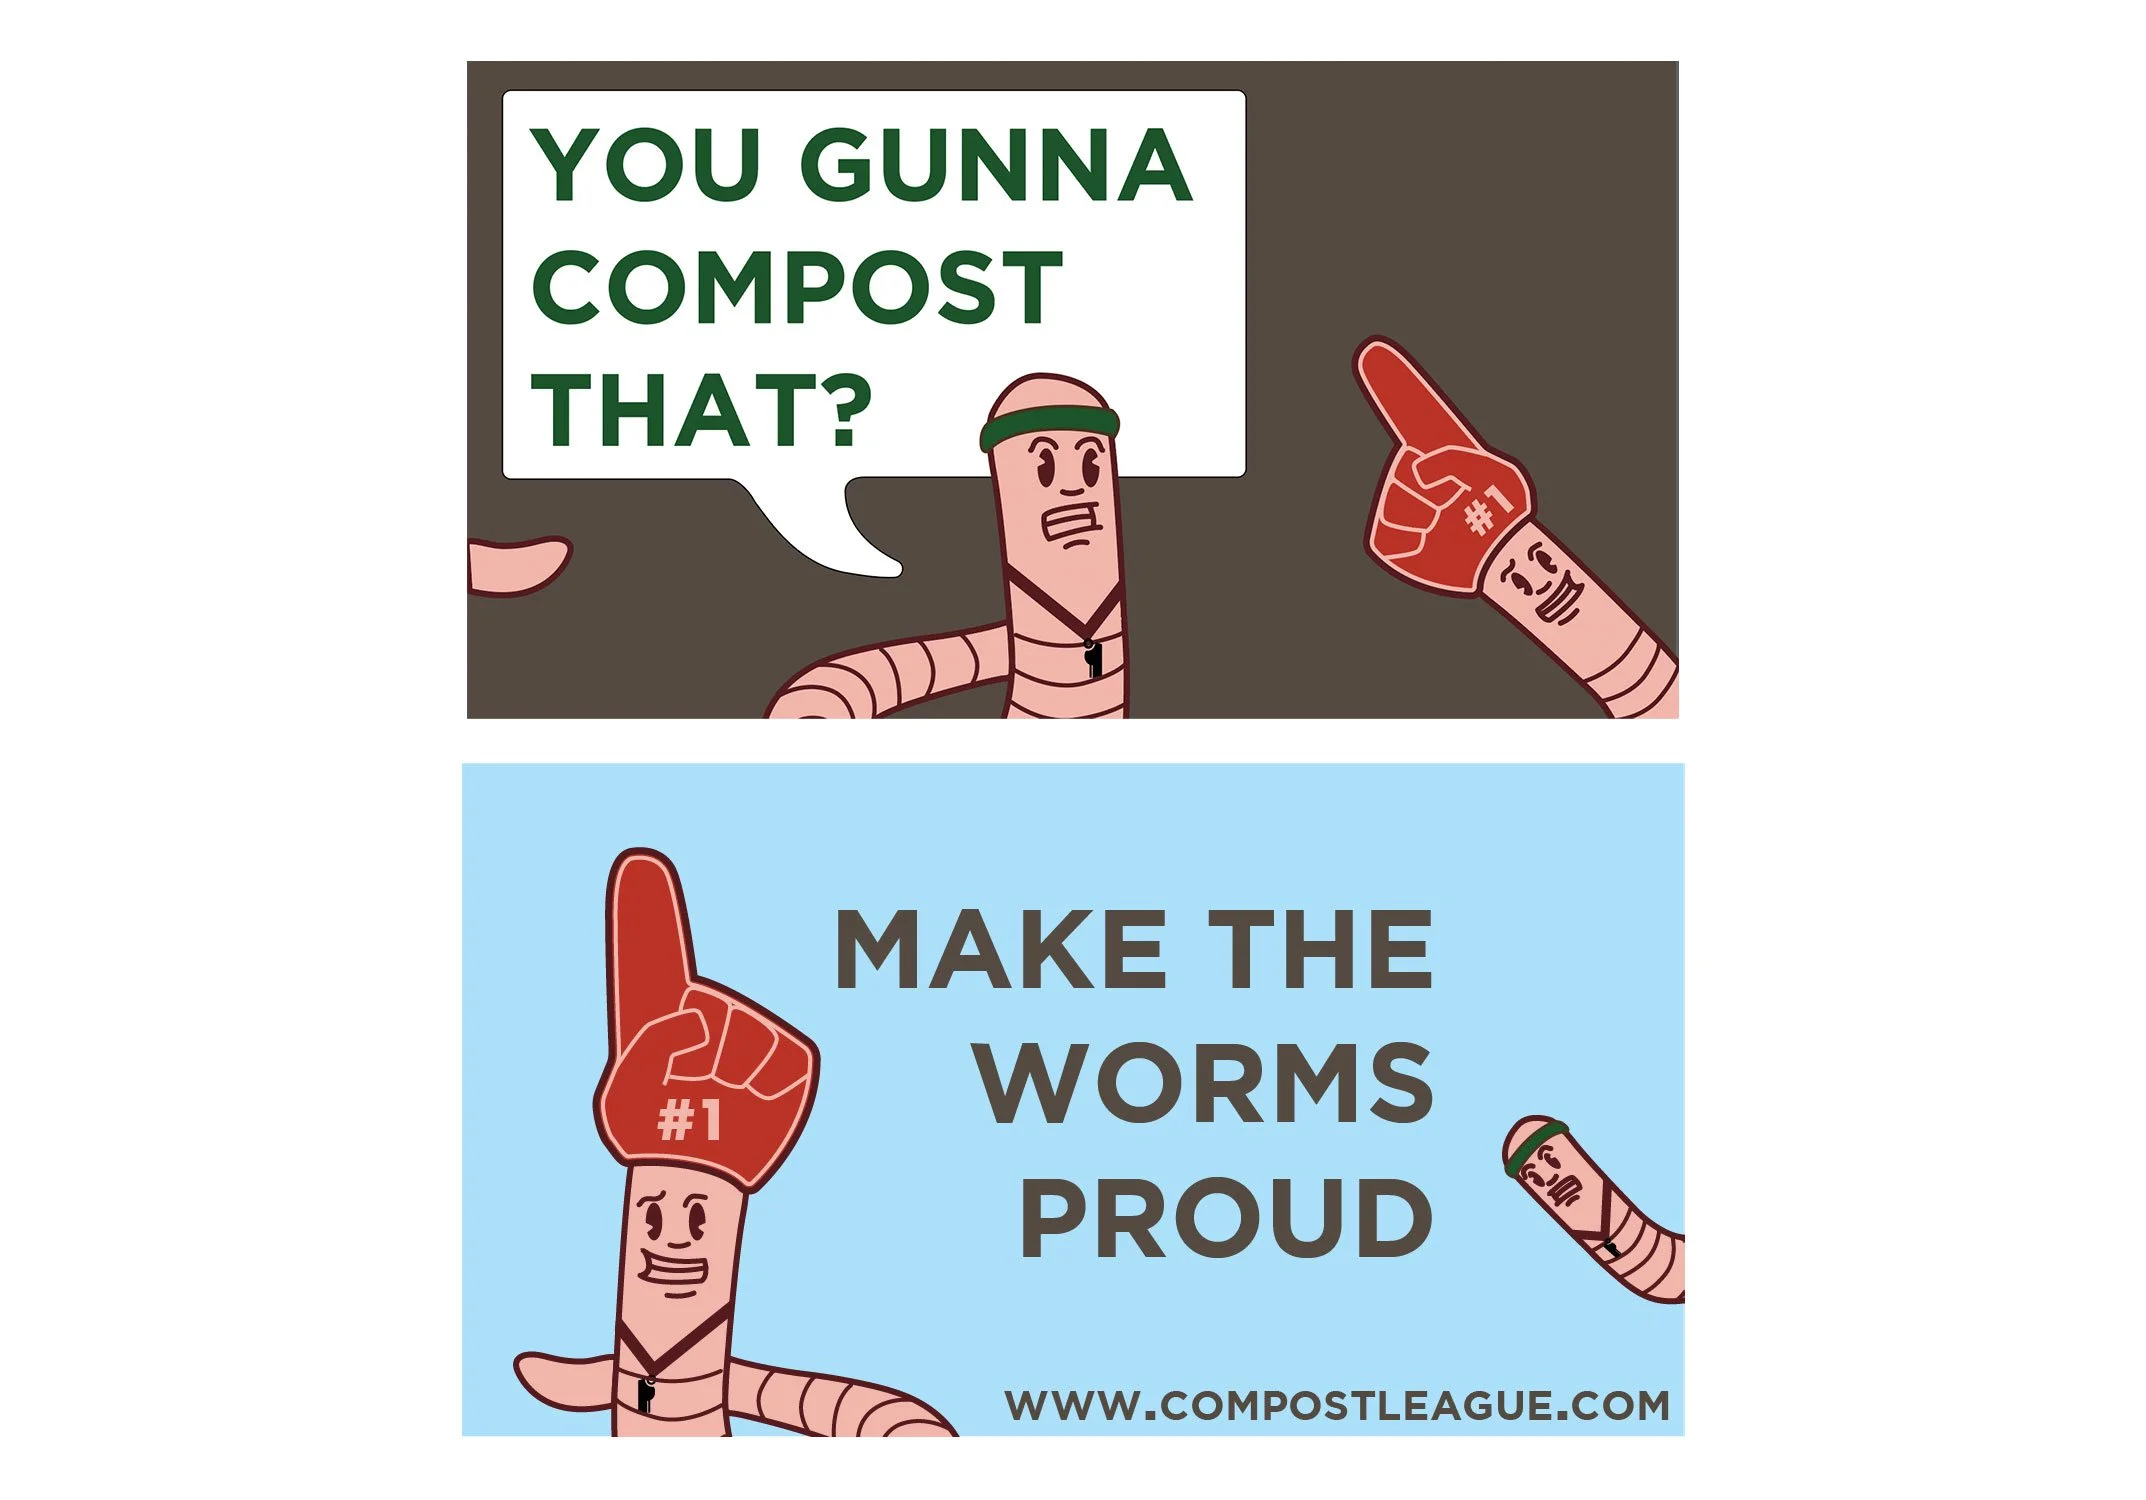
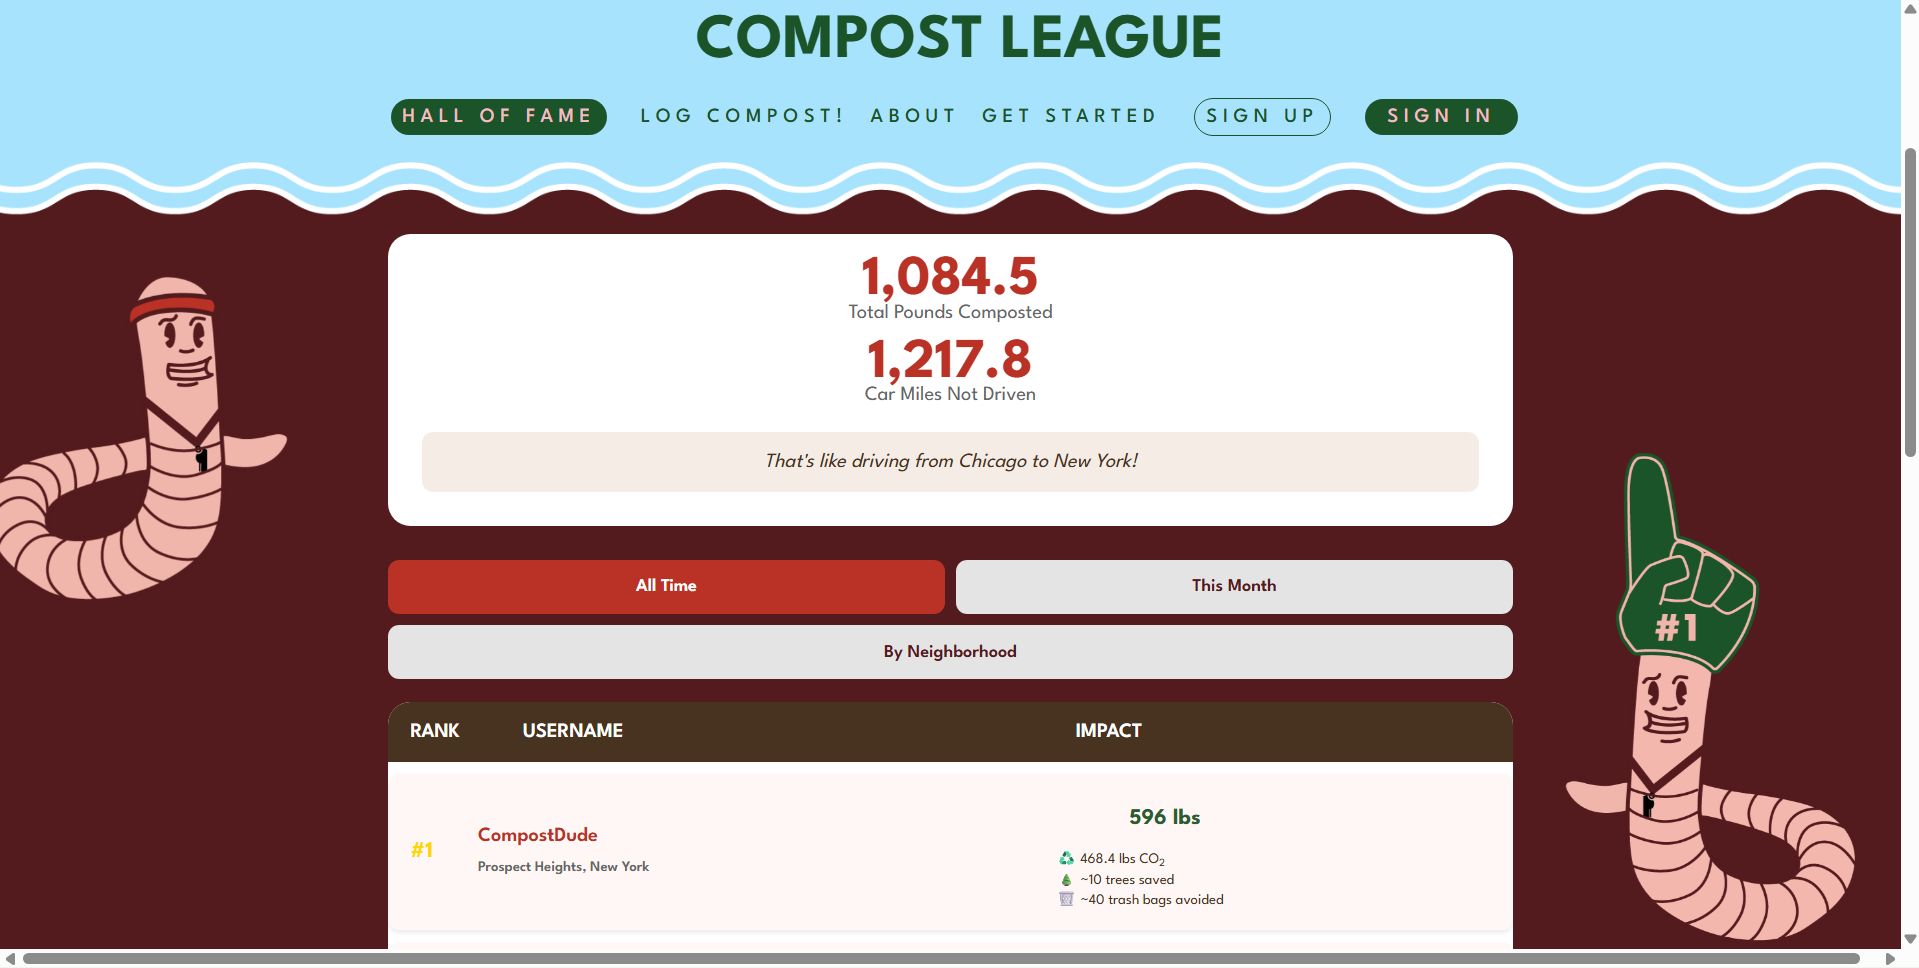
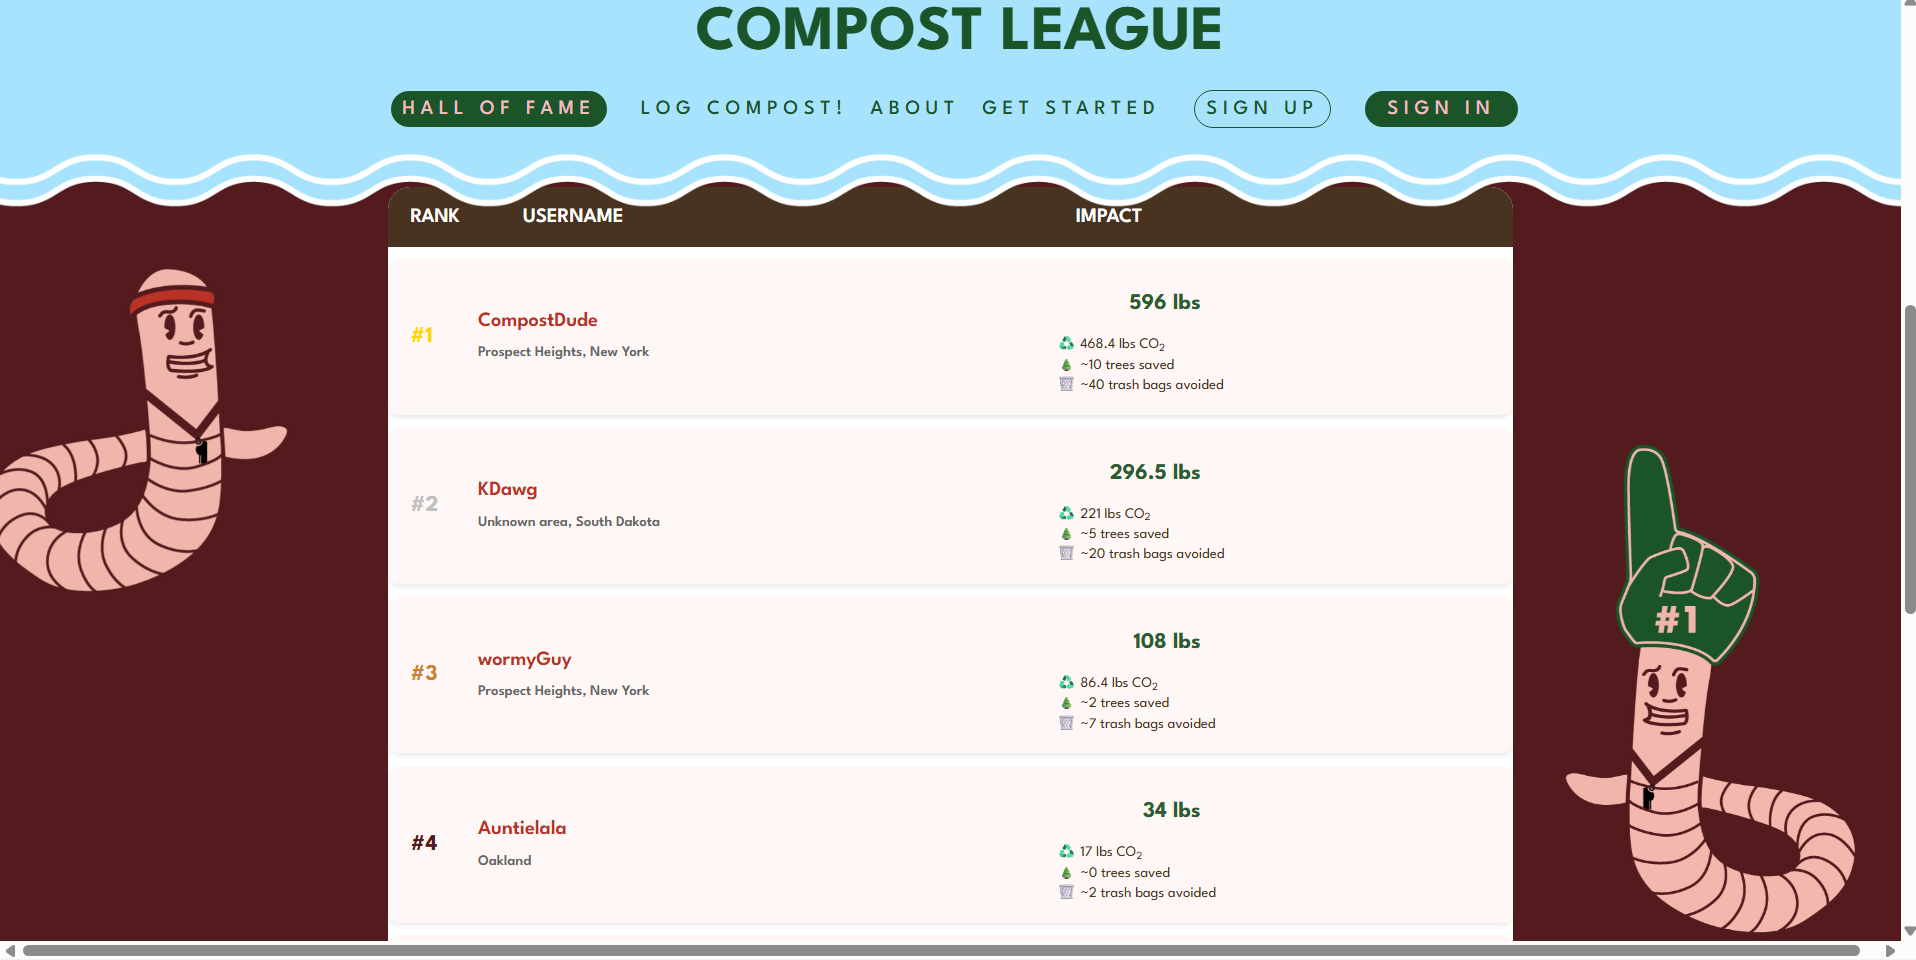
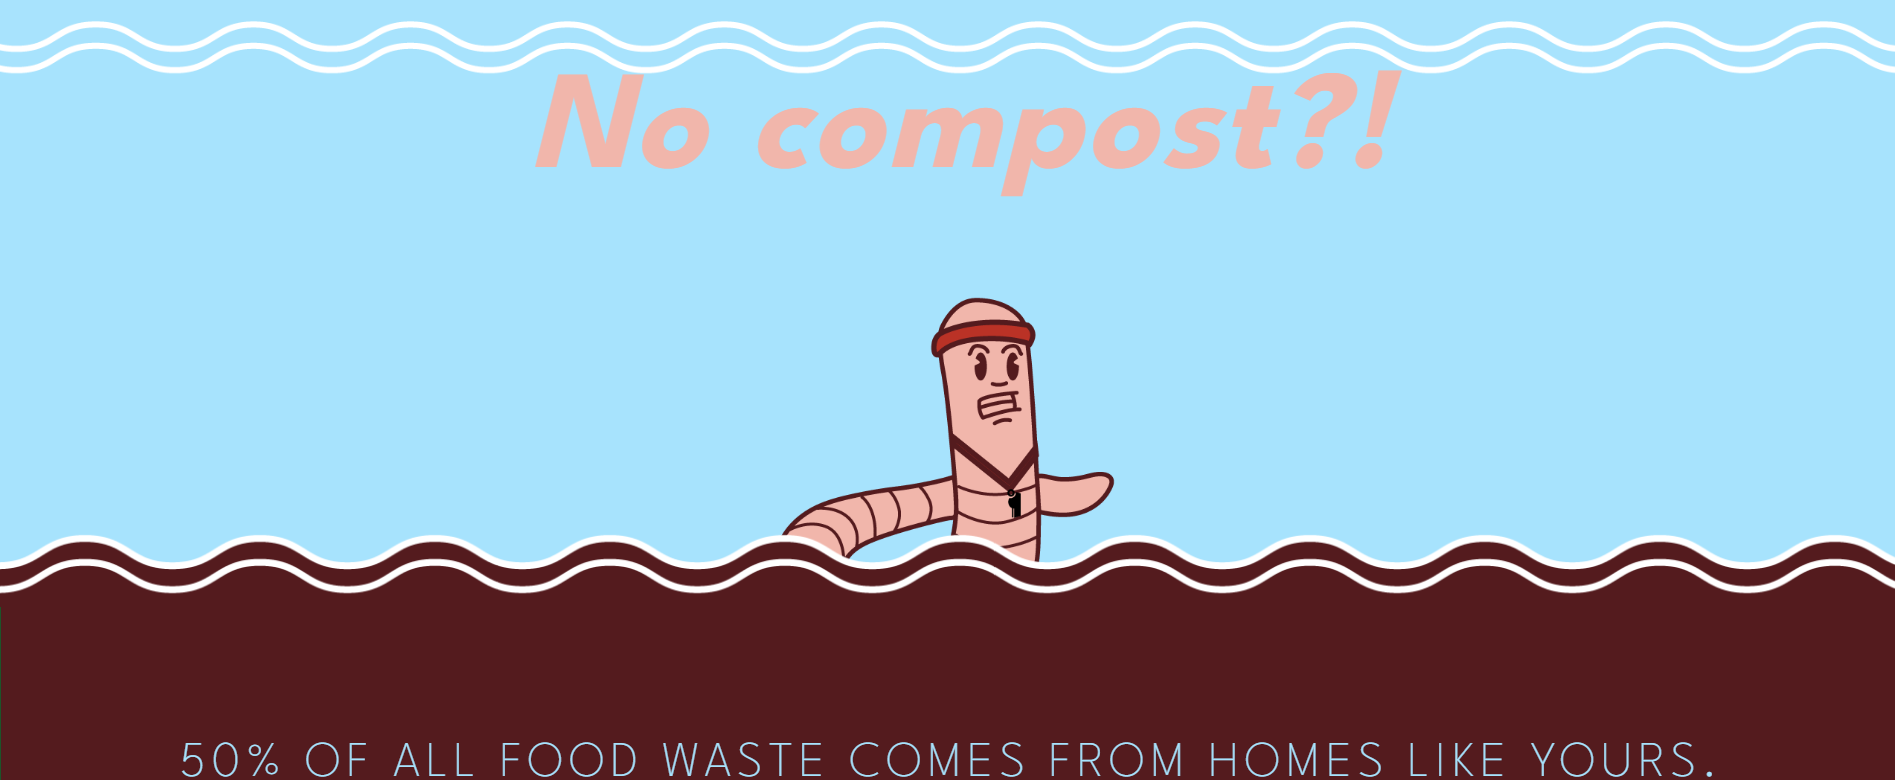
compost league
Digital tool · 2025
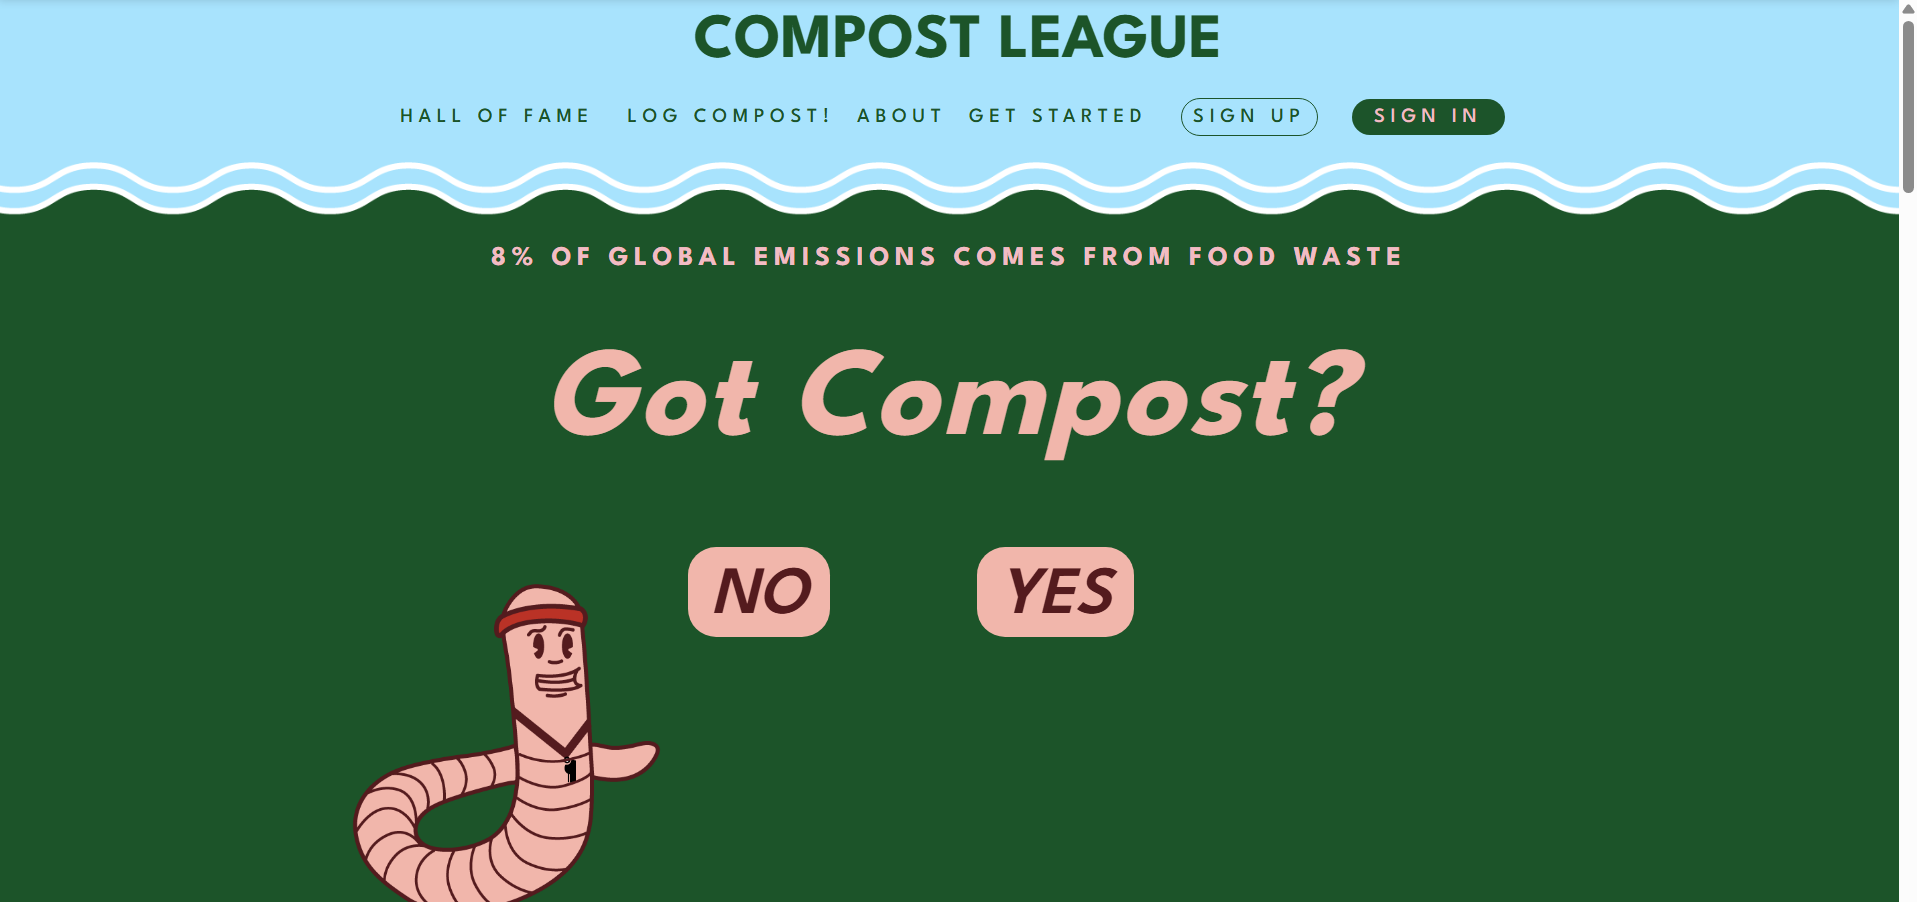
WHAT IF there were CITY-wIDE COMPOST COMPETITIONs?
It is estimated food waste generates 8% of global emissions. Inspired by the power of collective action and based on research into gamification, the Compost League strives to encourage some friendly competition to see who can compost the most?


PROJECT
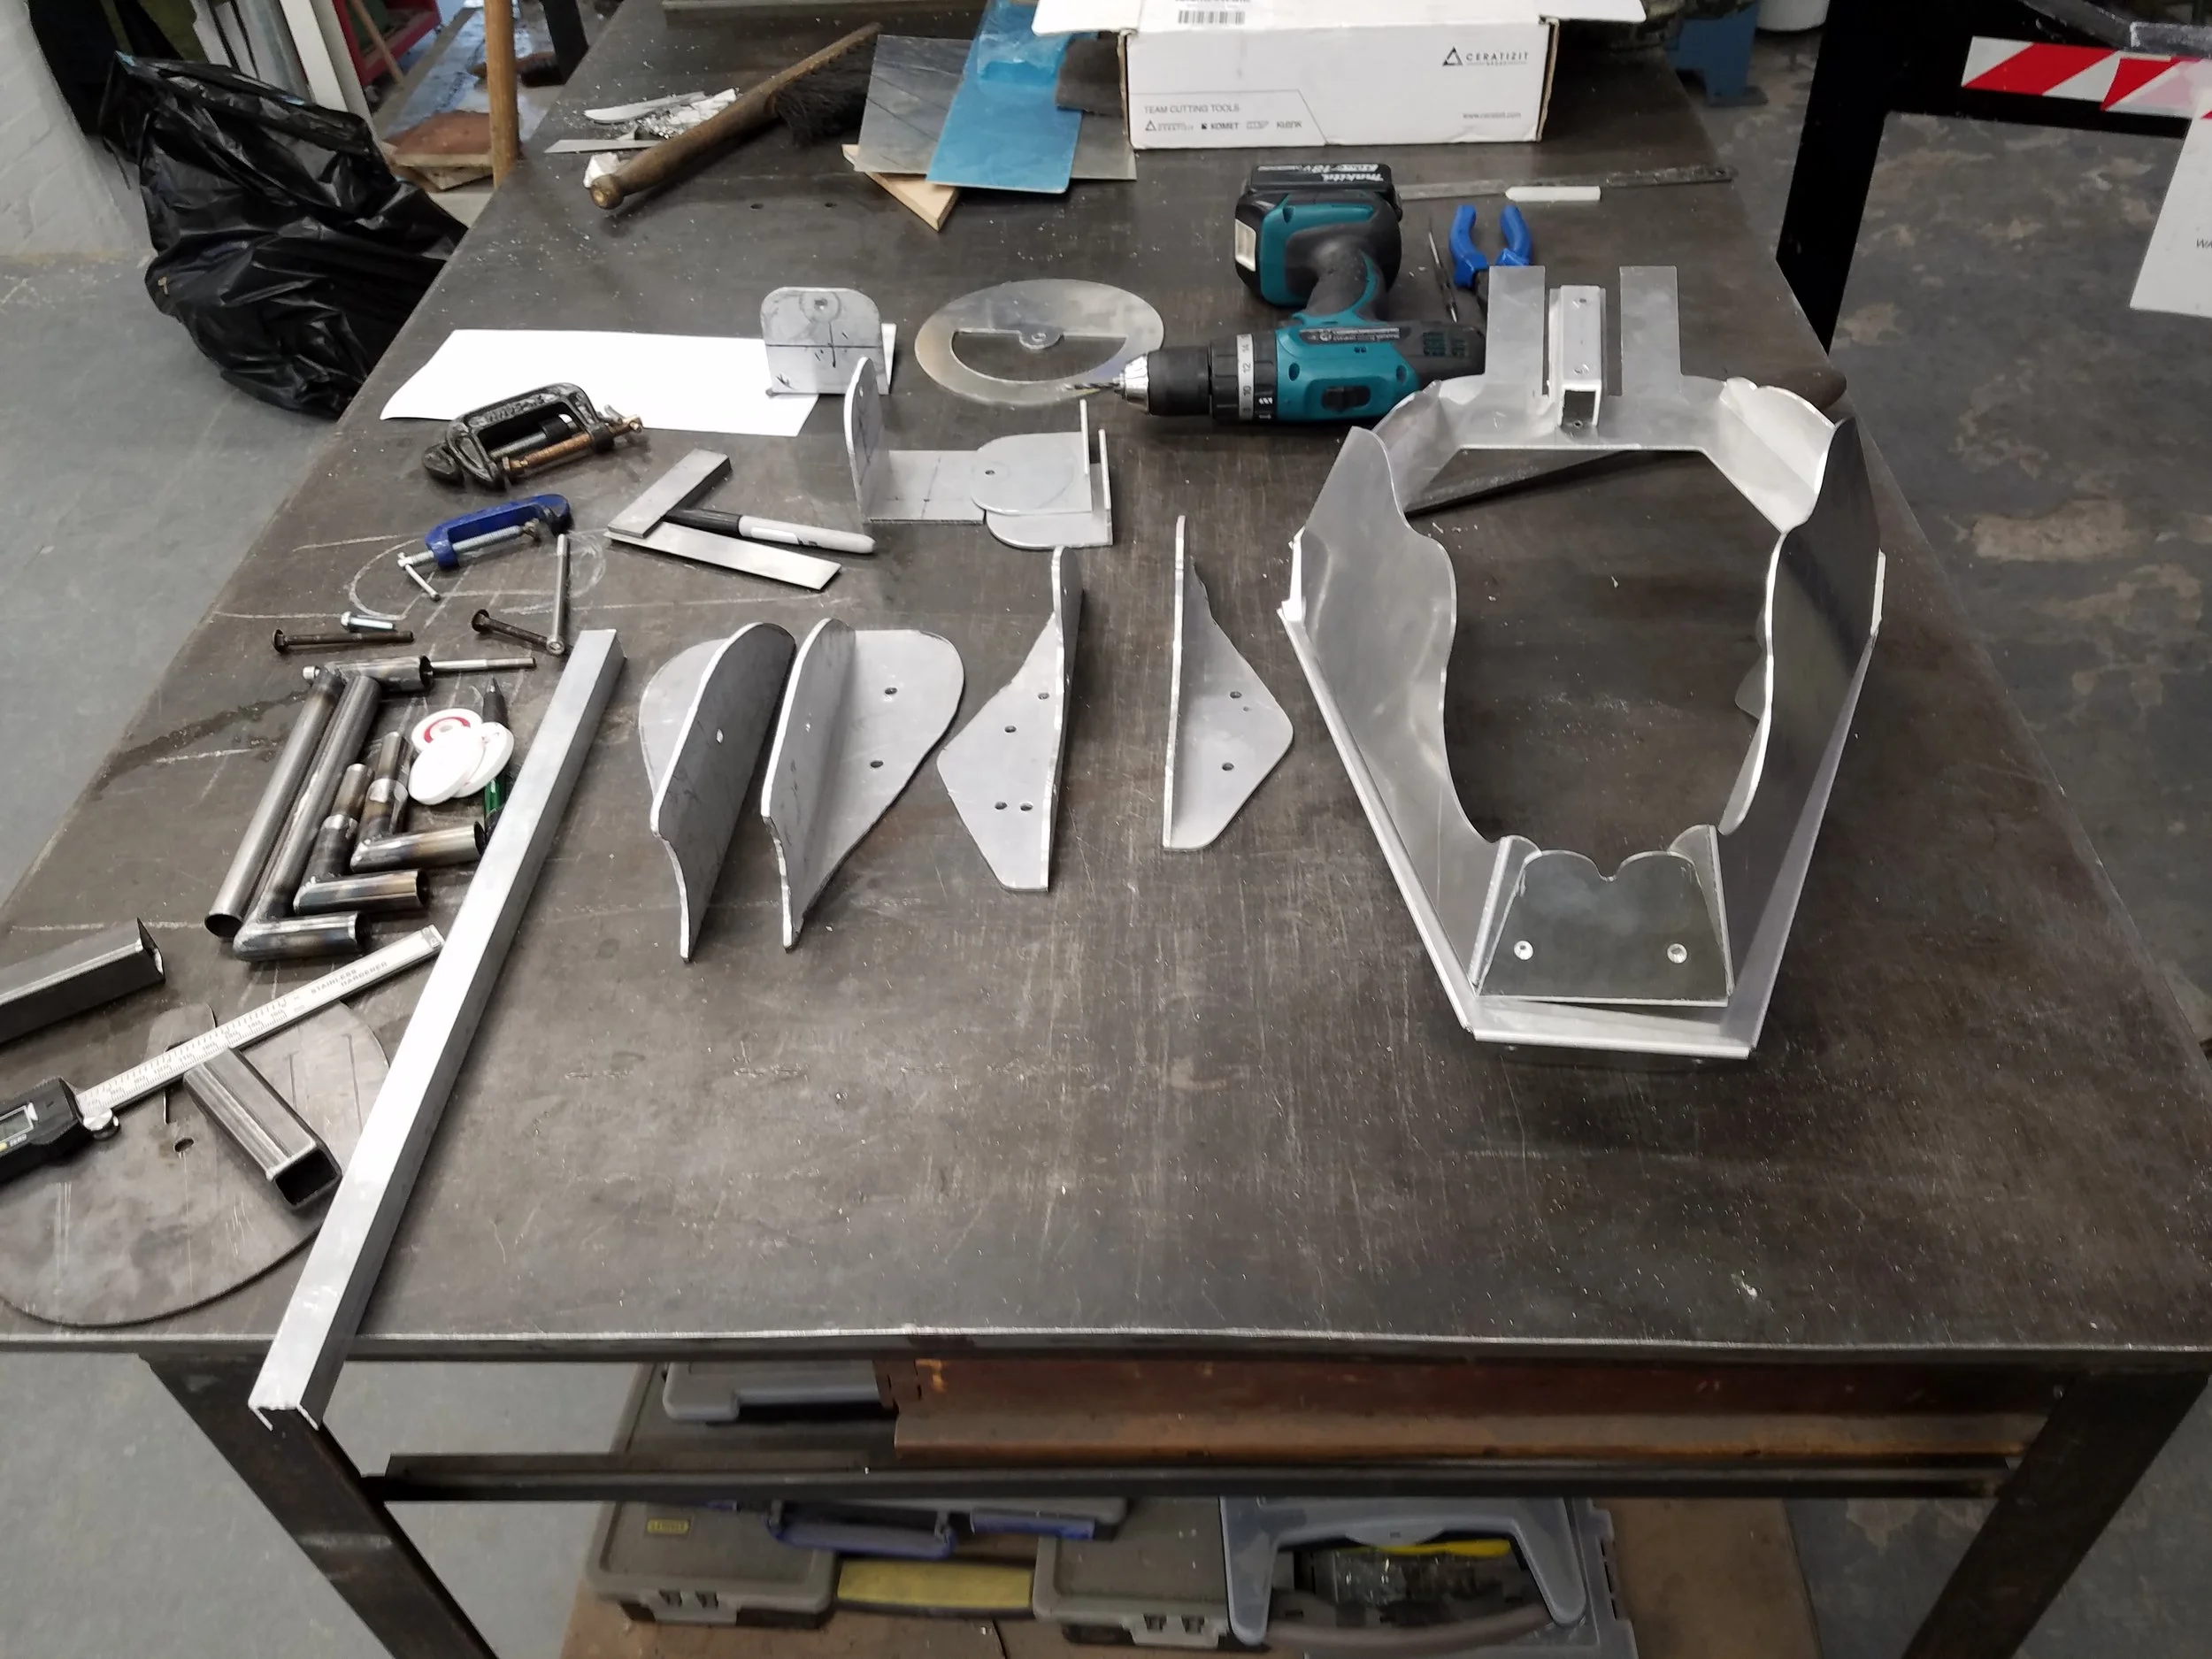
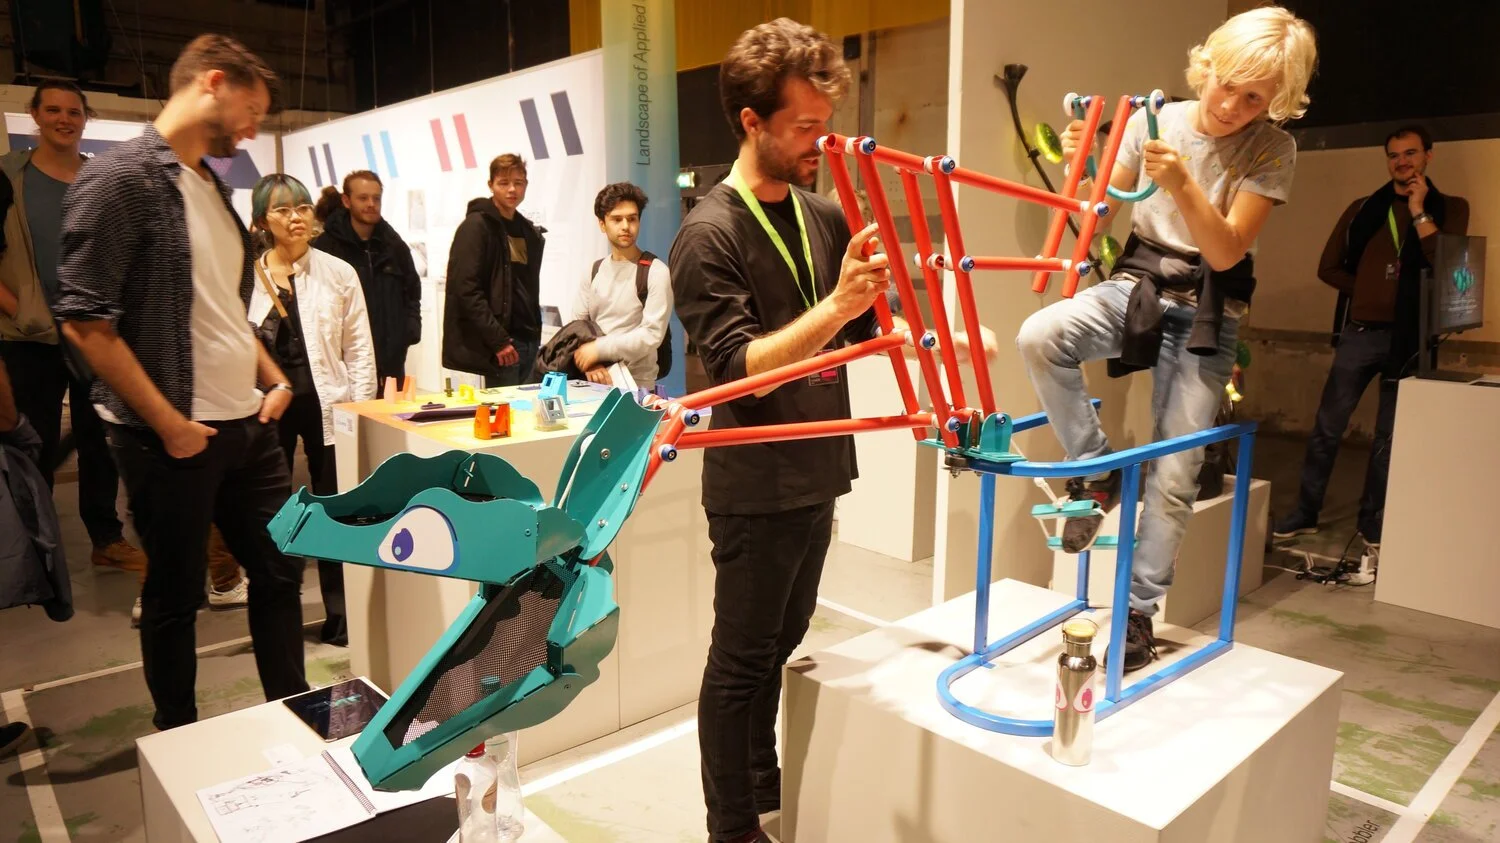
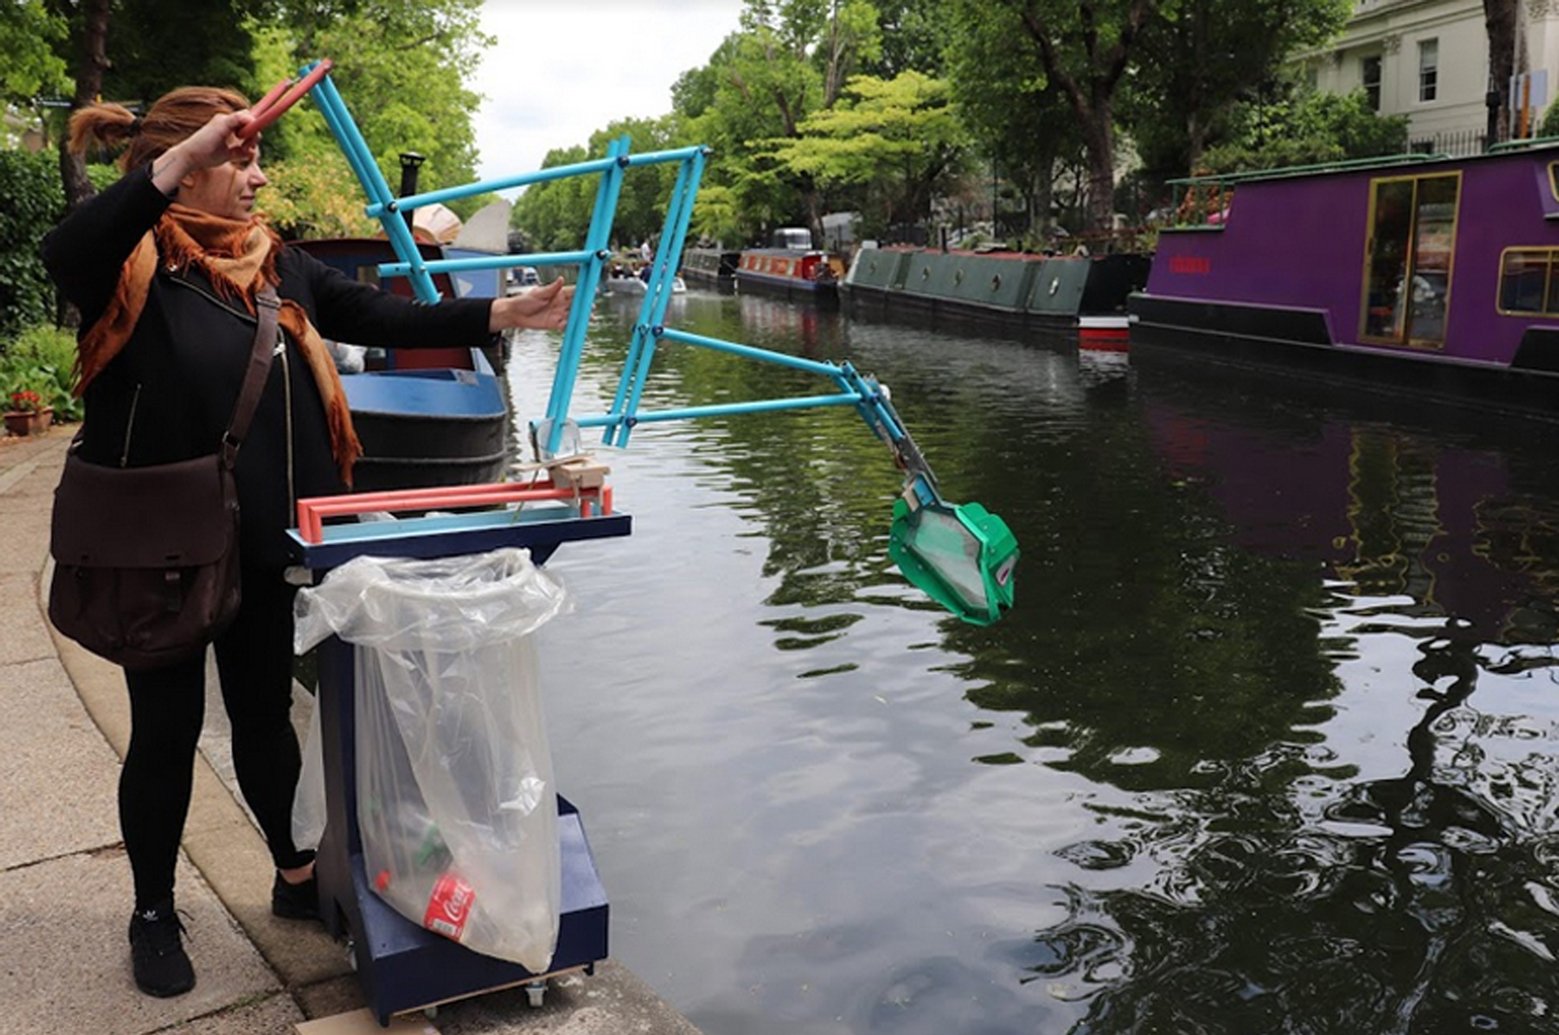
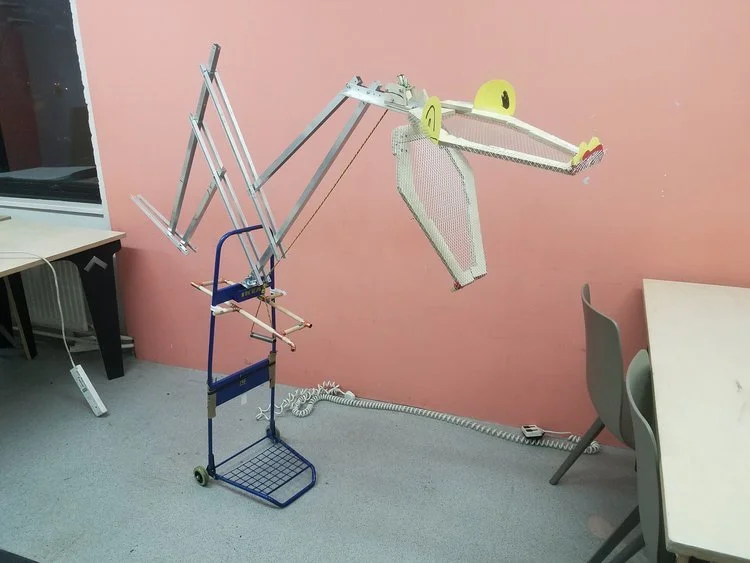
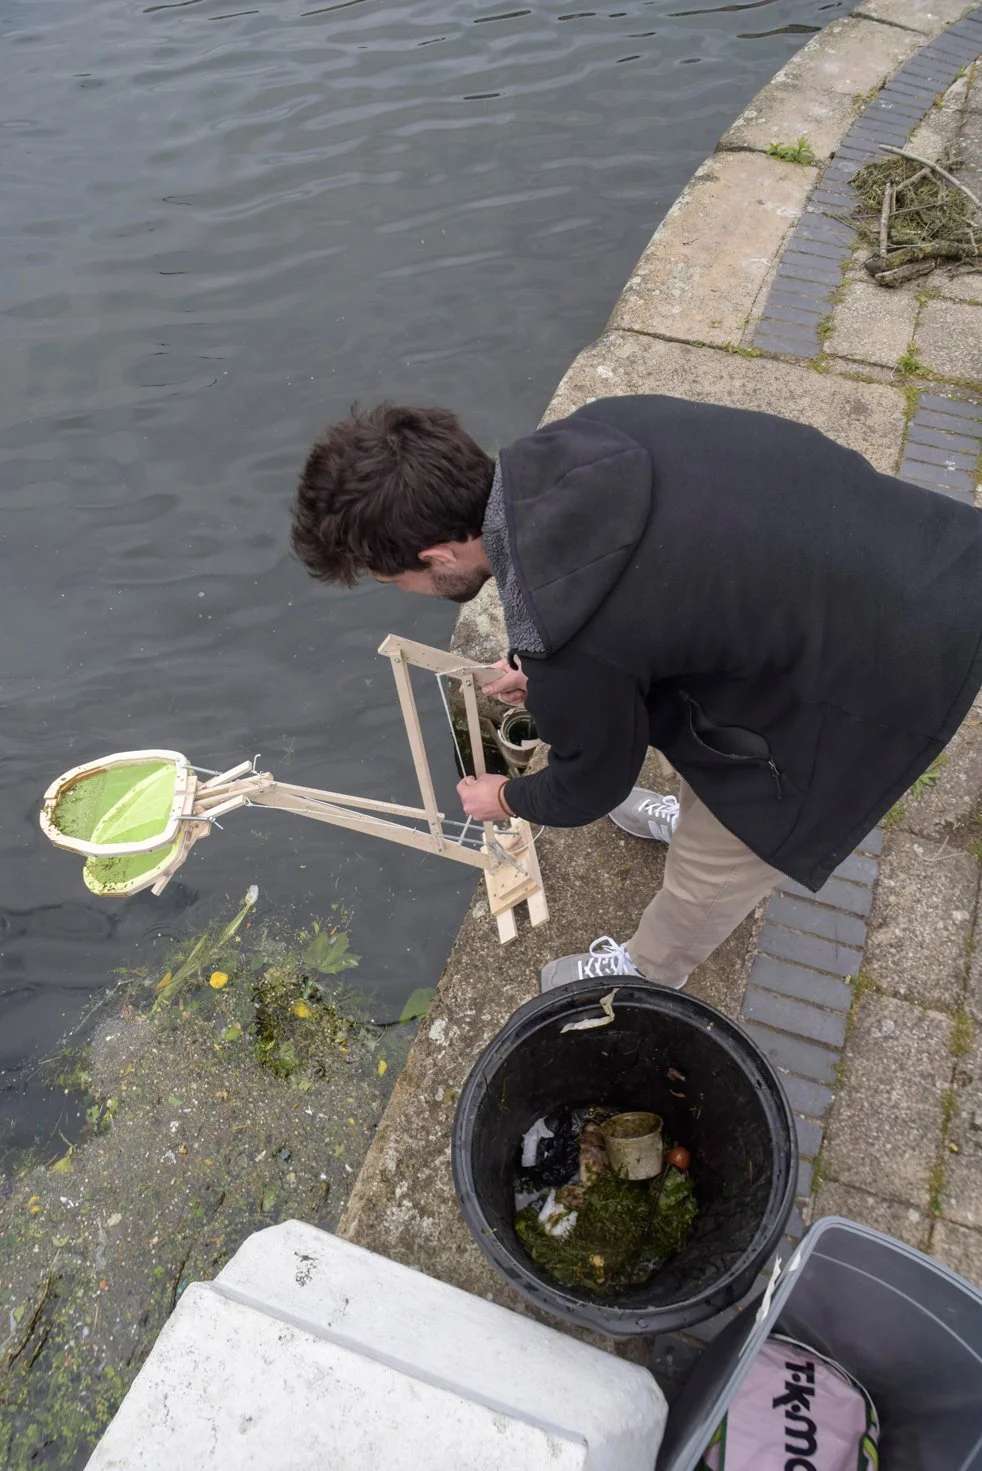
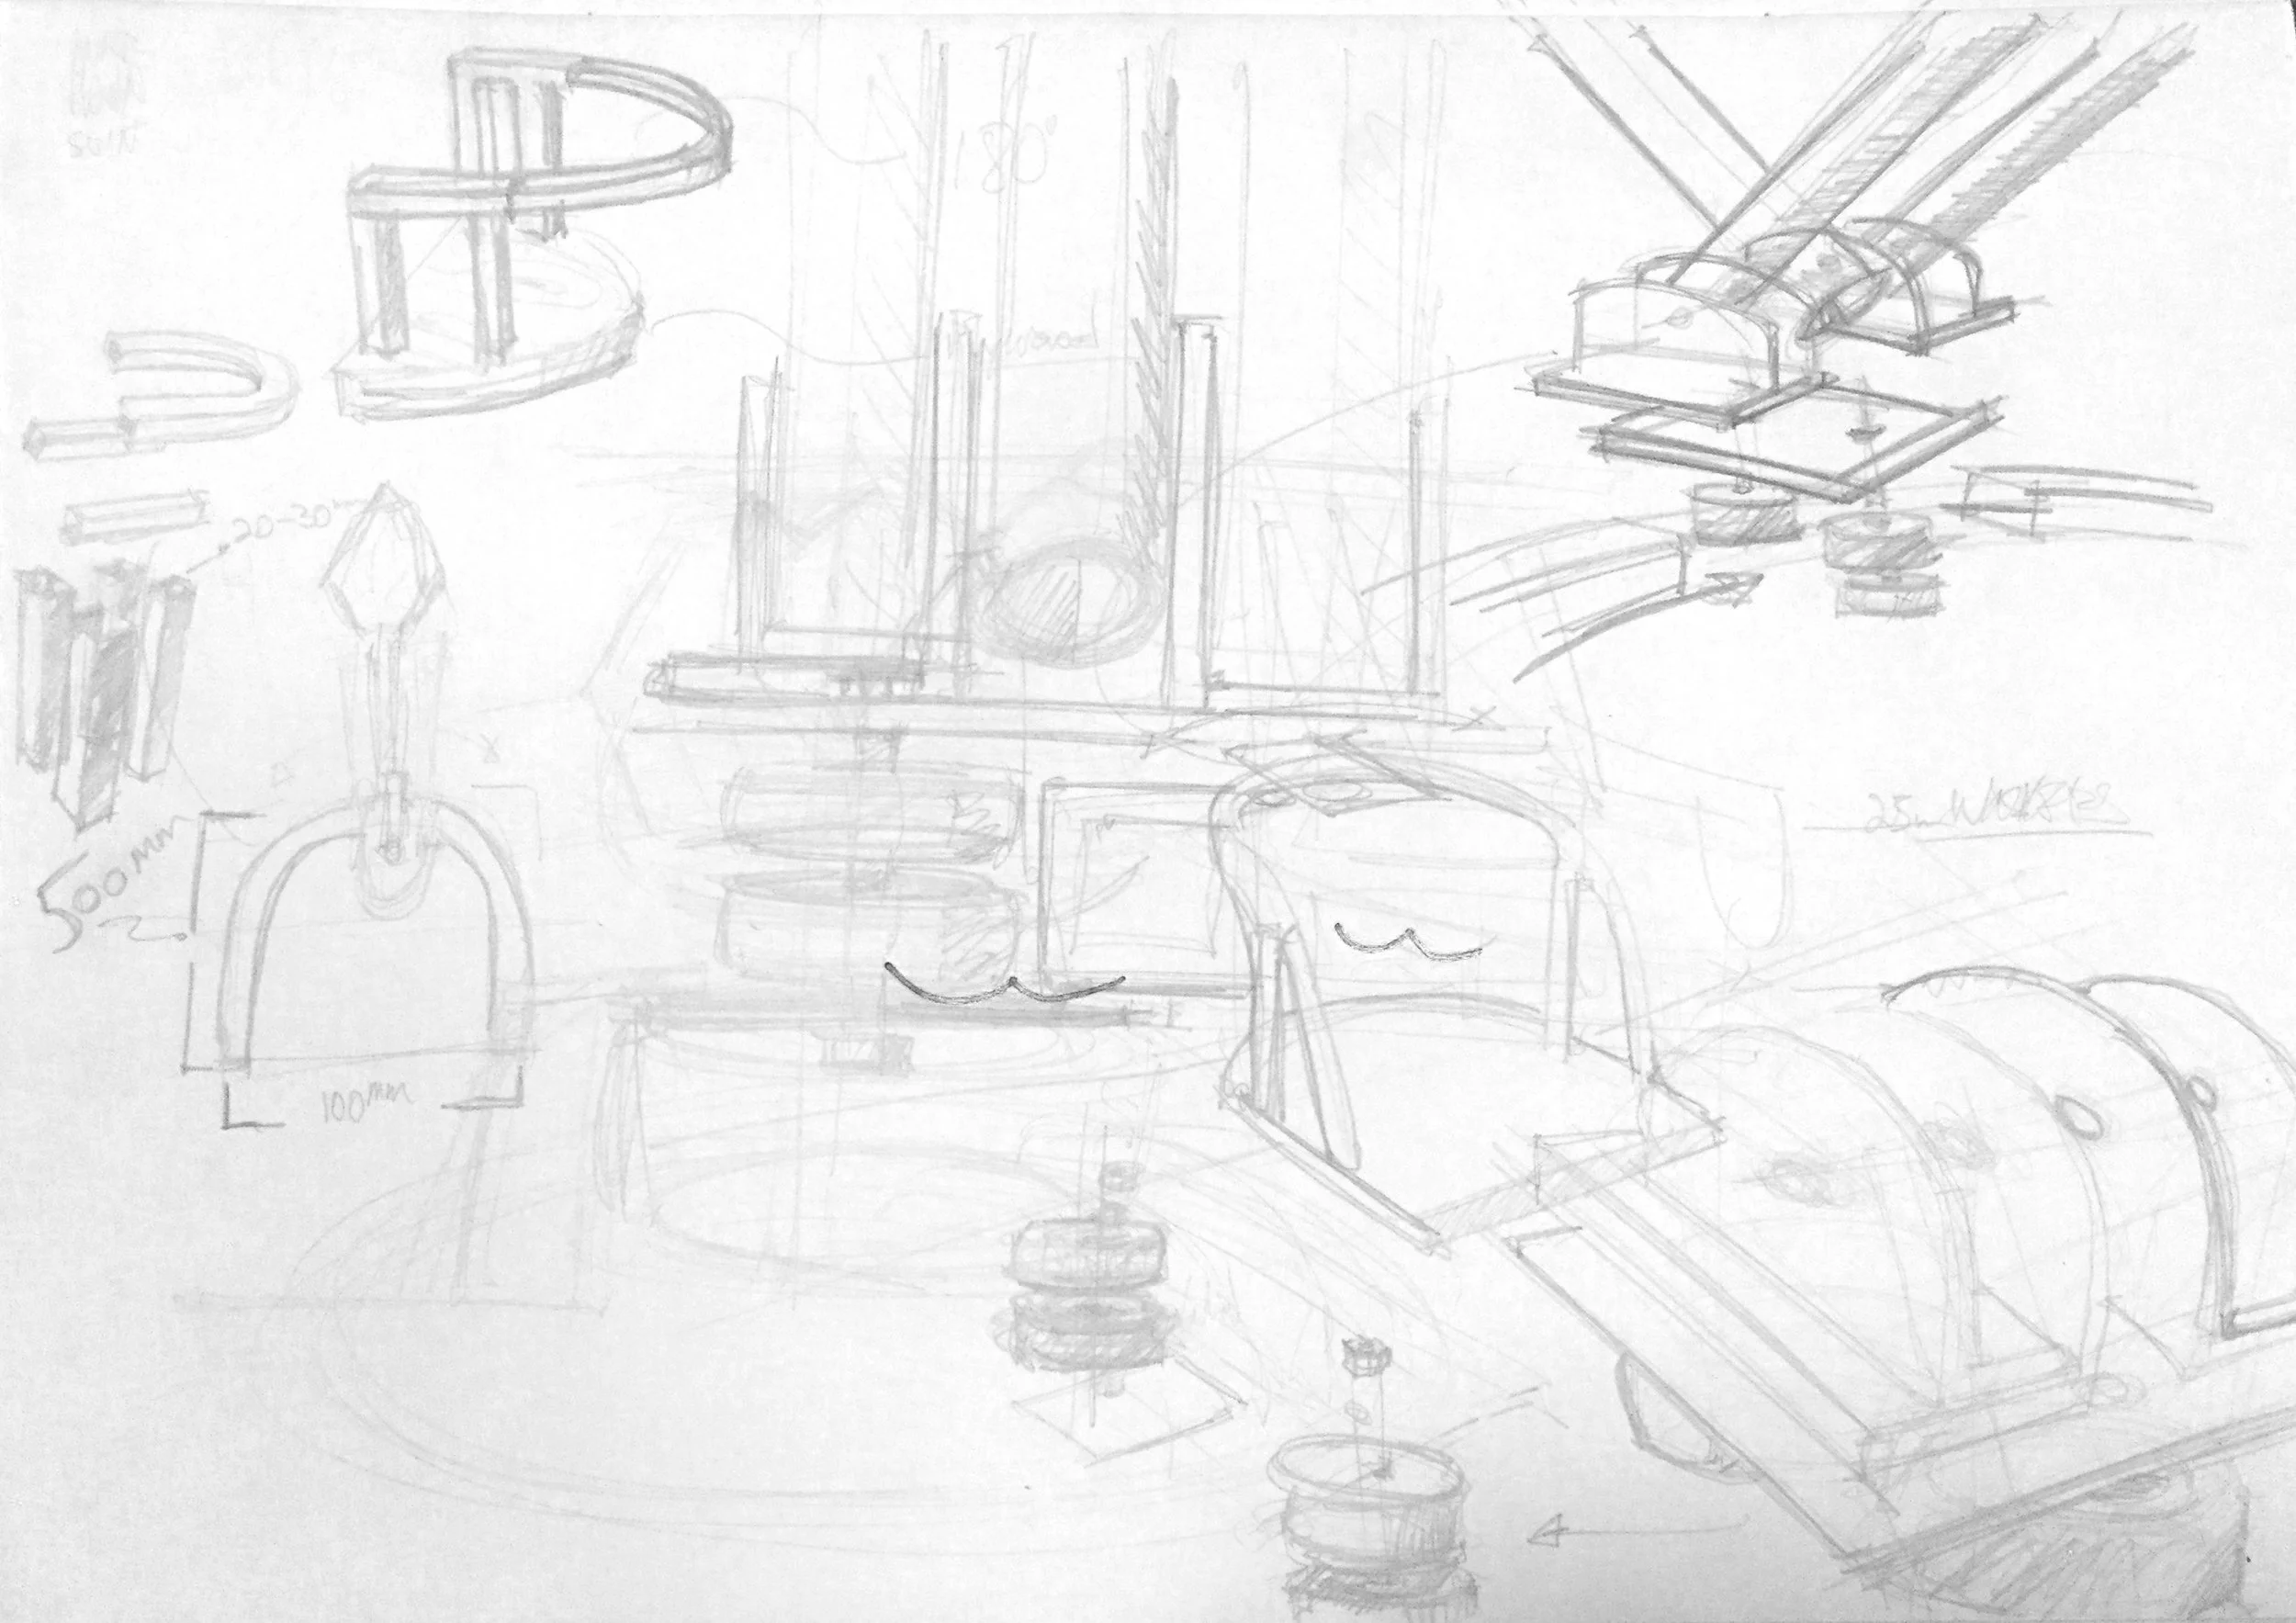
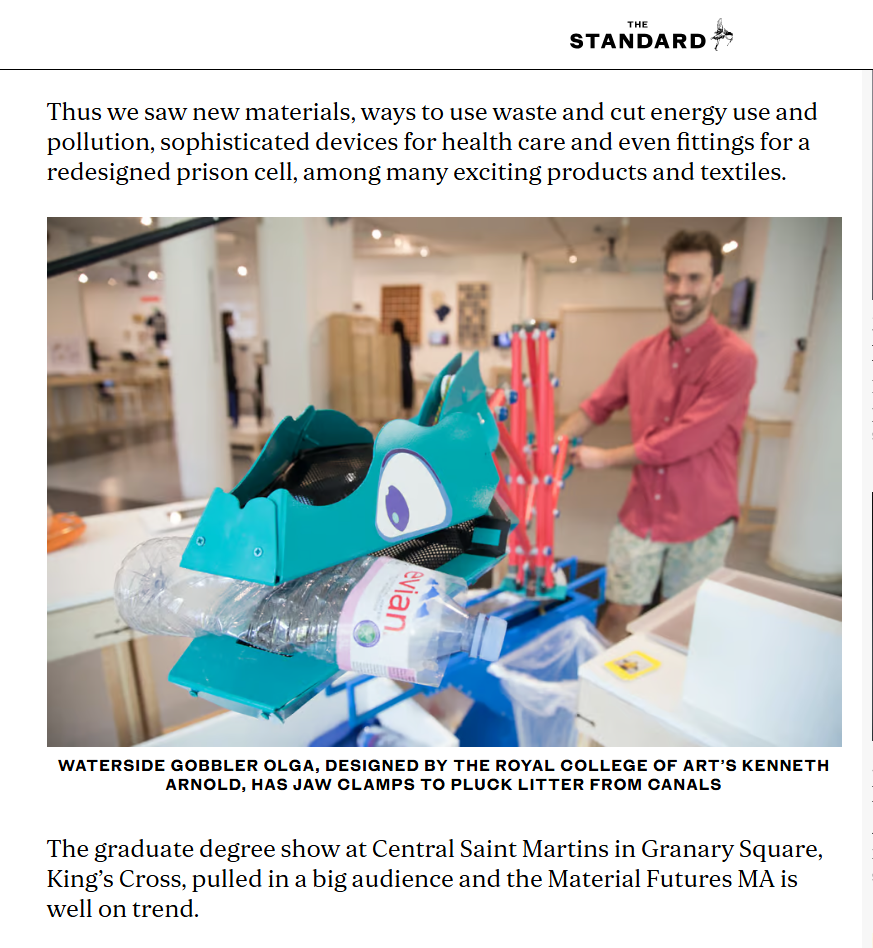
waterside gobbler
Public installation · 2019
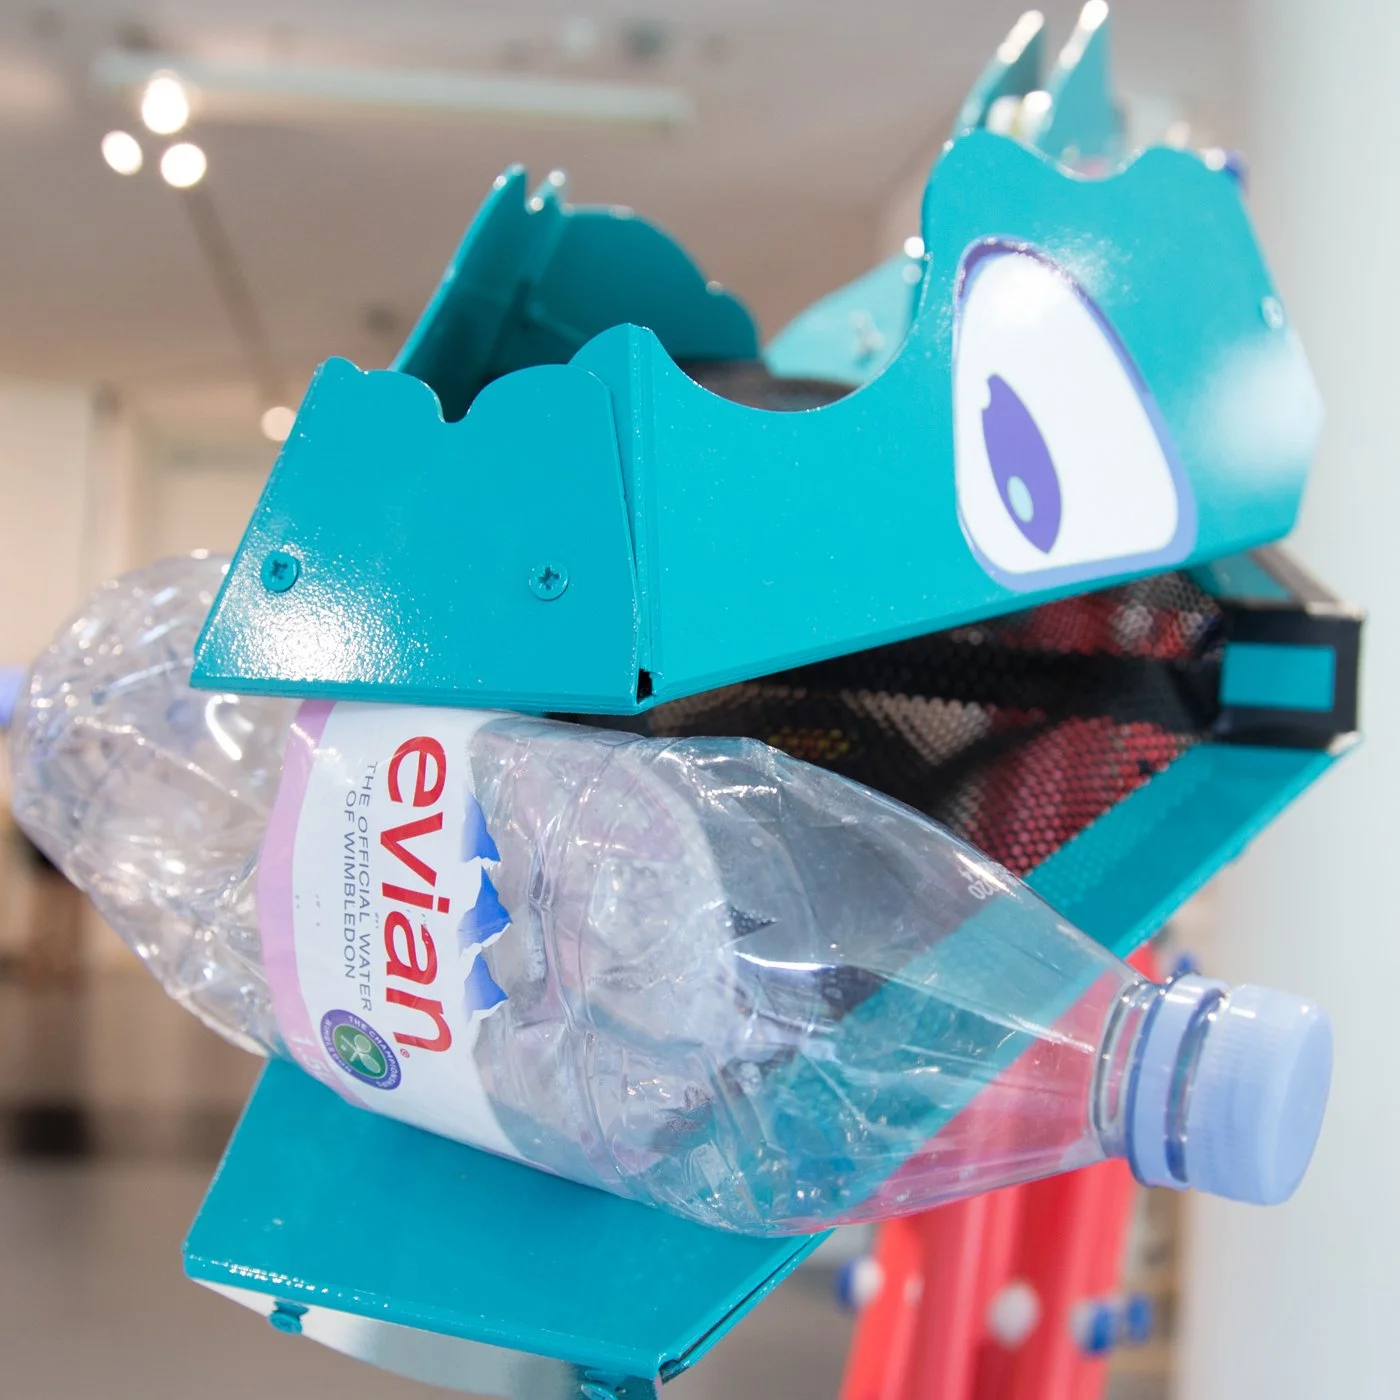
WHAT IF LITTER PICKING was gamified?
Unless its captured, plastic litter eventually makes its way downstream to rivers and oceans. Inspired by watching people go out of their way to pick up trash and get land. The Waterside Gobbler was designed as a plastic fishing game for urban waterways that connects citizens to this global problem in a engaging and playful activation.
Created during my graduate design work at the Royal College of Art as a temporary installation, the Gobbler received unsolicited applause from passing boaters and prompted requests from pedestrians who wanted to try, demonstrating that play is a trigger for pro-social behavior.

PROJECT
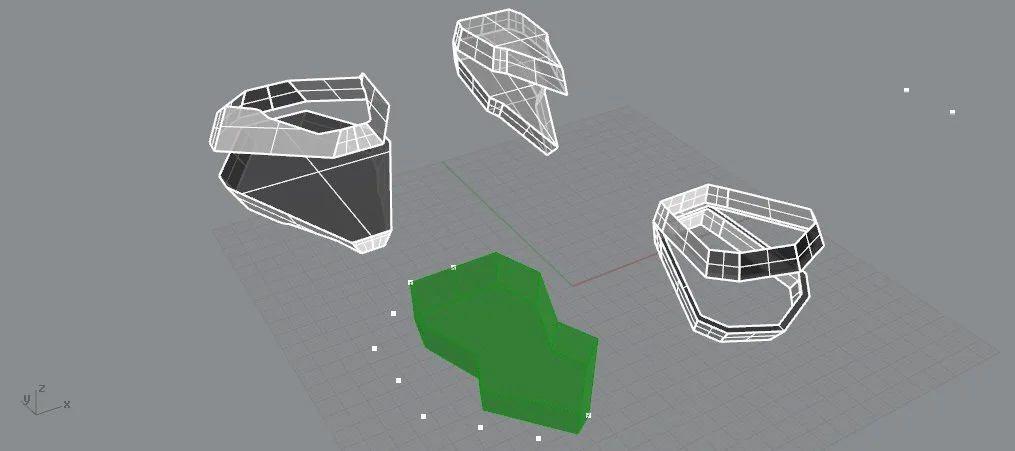
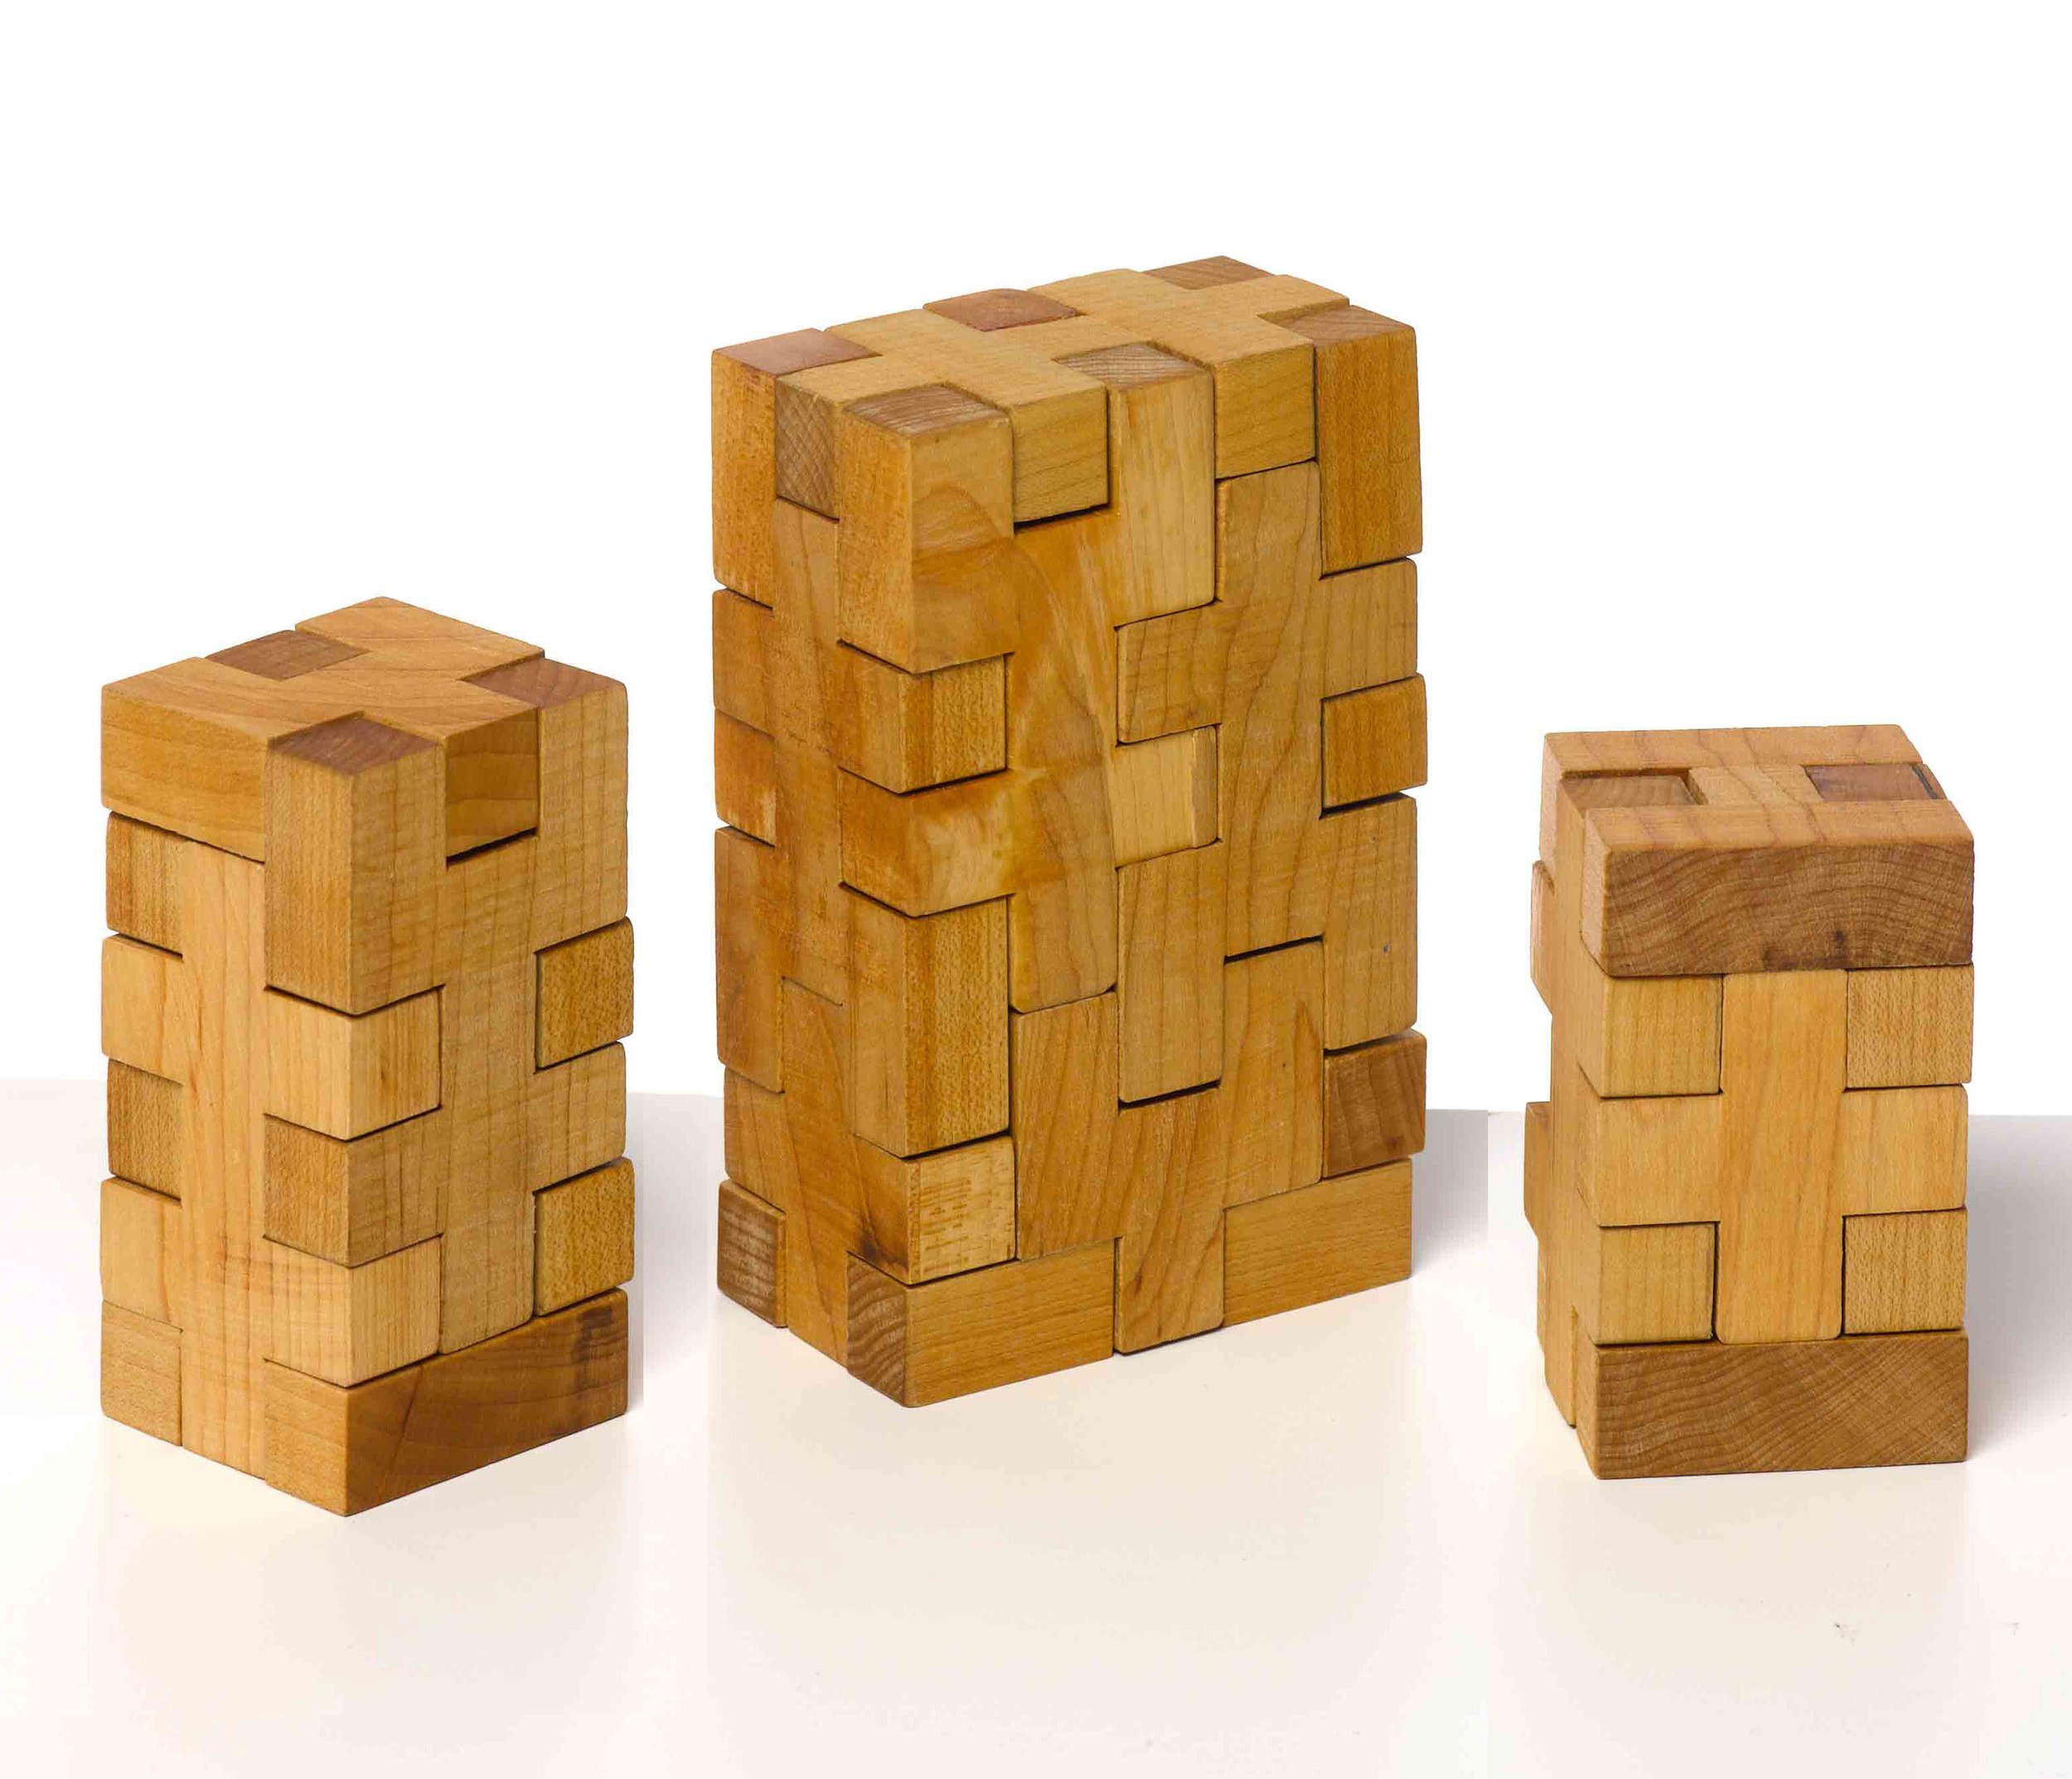
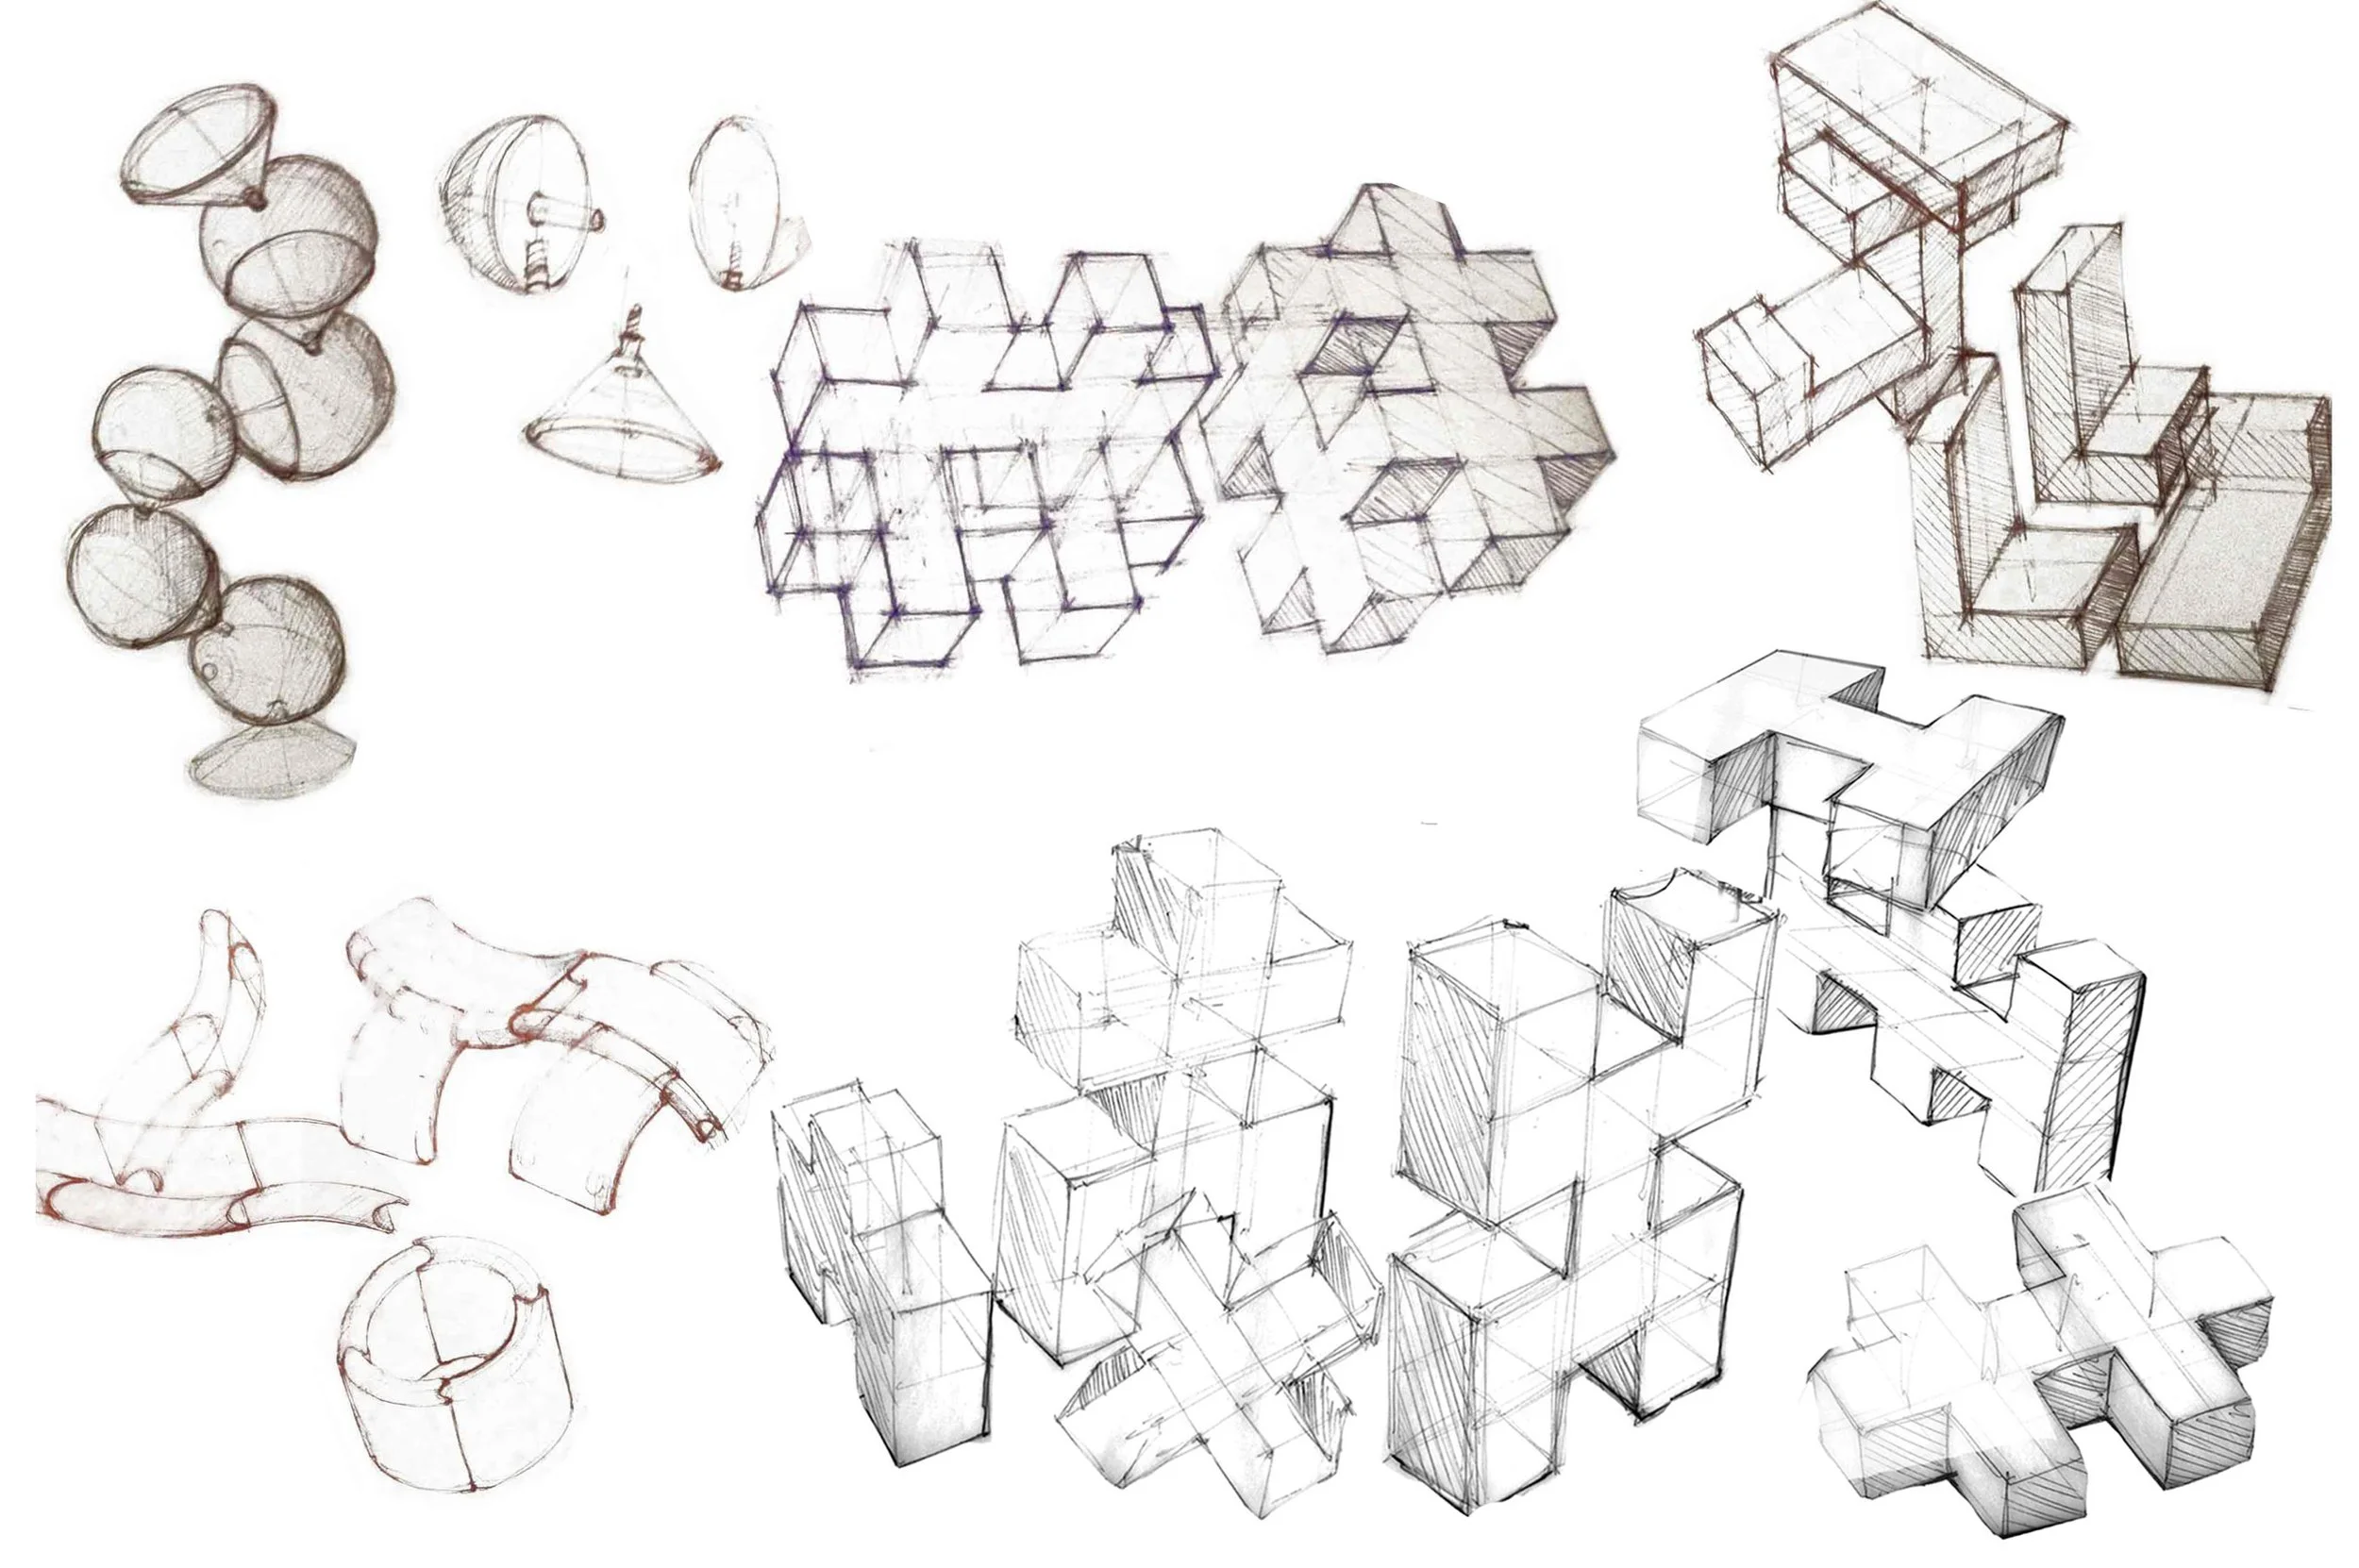
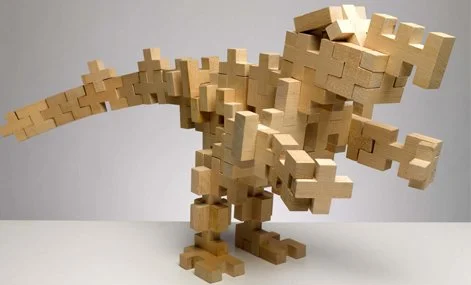
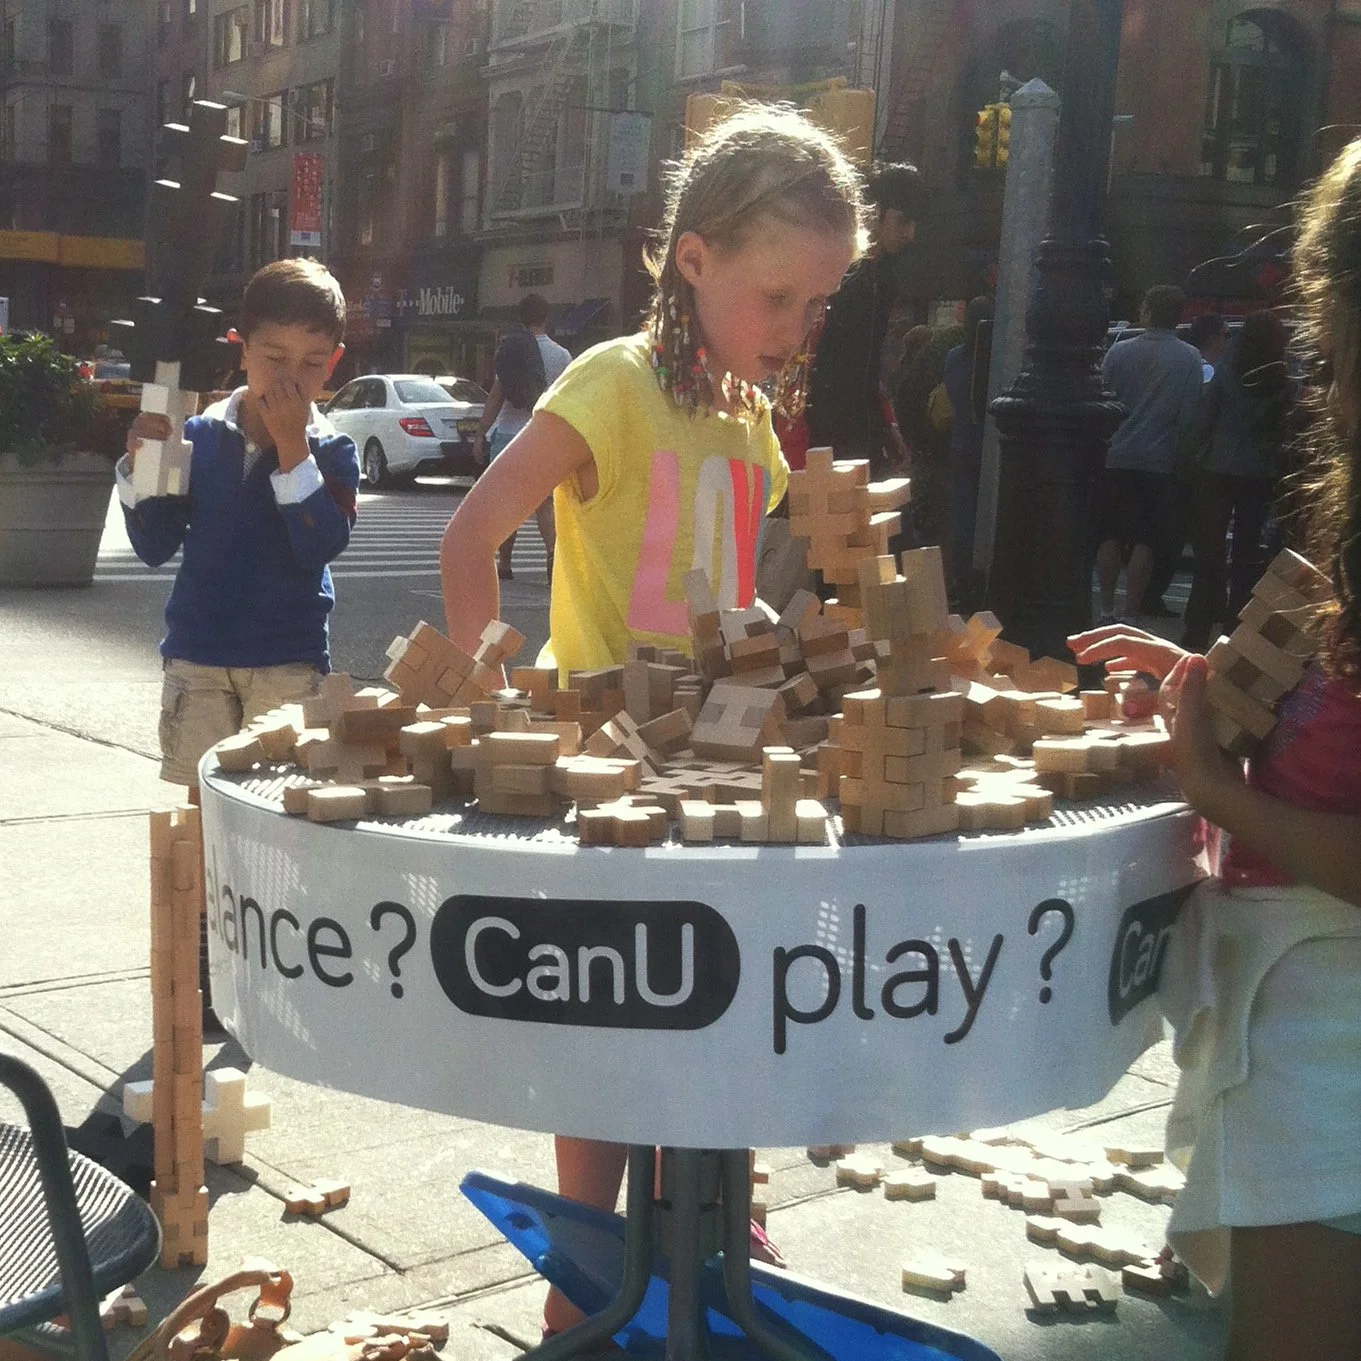
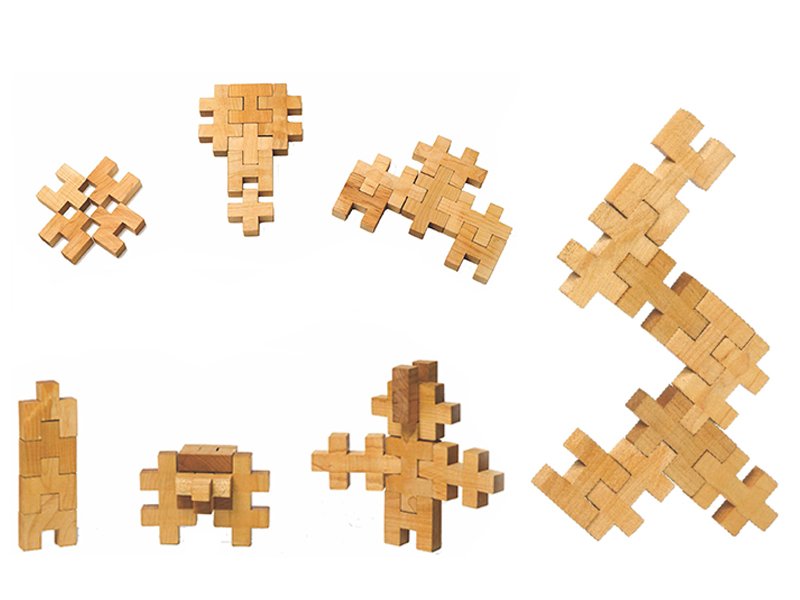
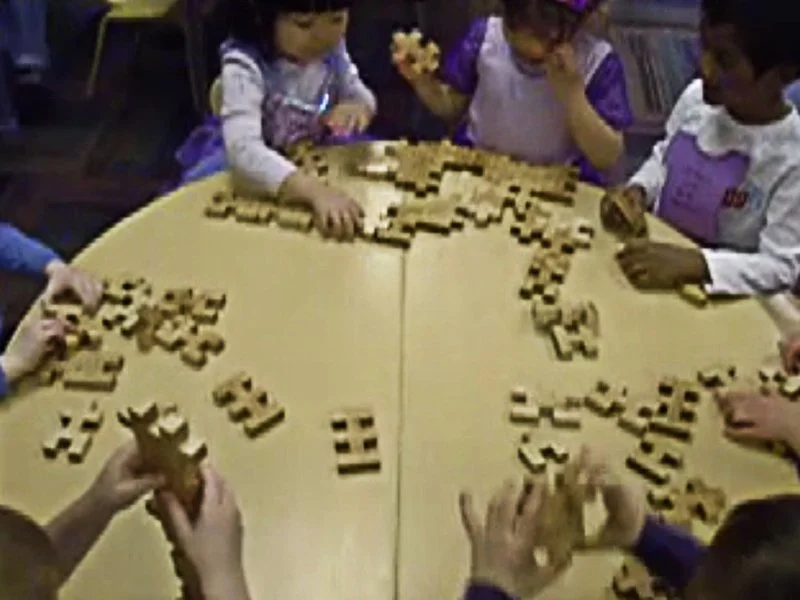
CANU BLOCKS
Toy design · 2011

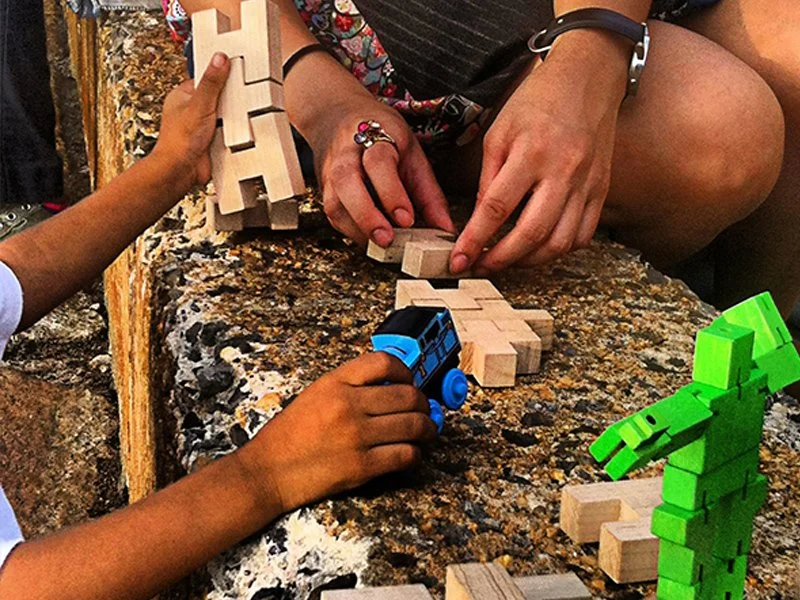
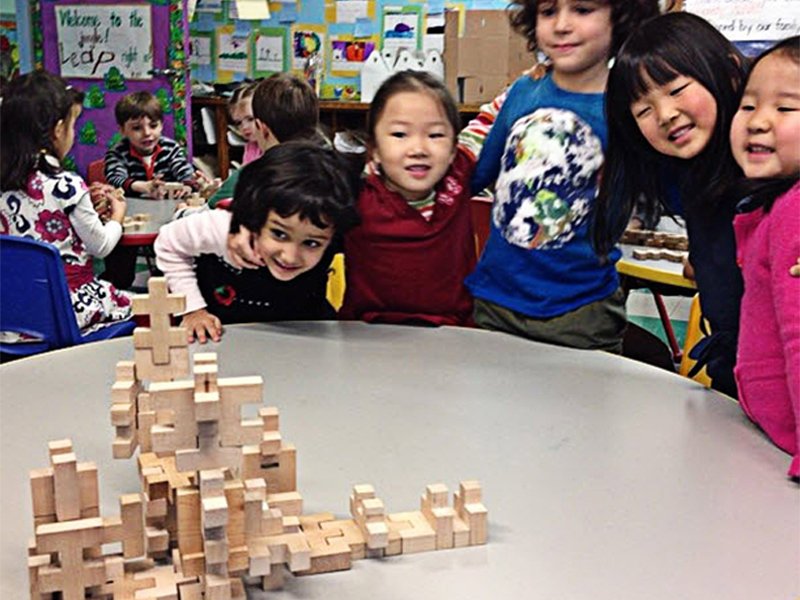
WHAT IF A TOY GREW WITH OUR ABILITY TO UNDERSTAND IT?
Inspired by developmental psychology frameworks - CanU is a set of modular building blocks designed to spark open-ended creative play that engages kids and challenges adults.
This project embodies the fundamentals we still use today — prototyping quickly, testing with real users, and designing systems that invite participation rather than prescribe behavior. It was also a demonstration of how physical products can generate a range of pro-social behaviors and how human interactions evolve as we age from kids to adults.
Press
RECOGNITION
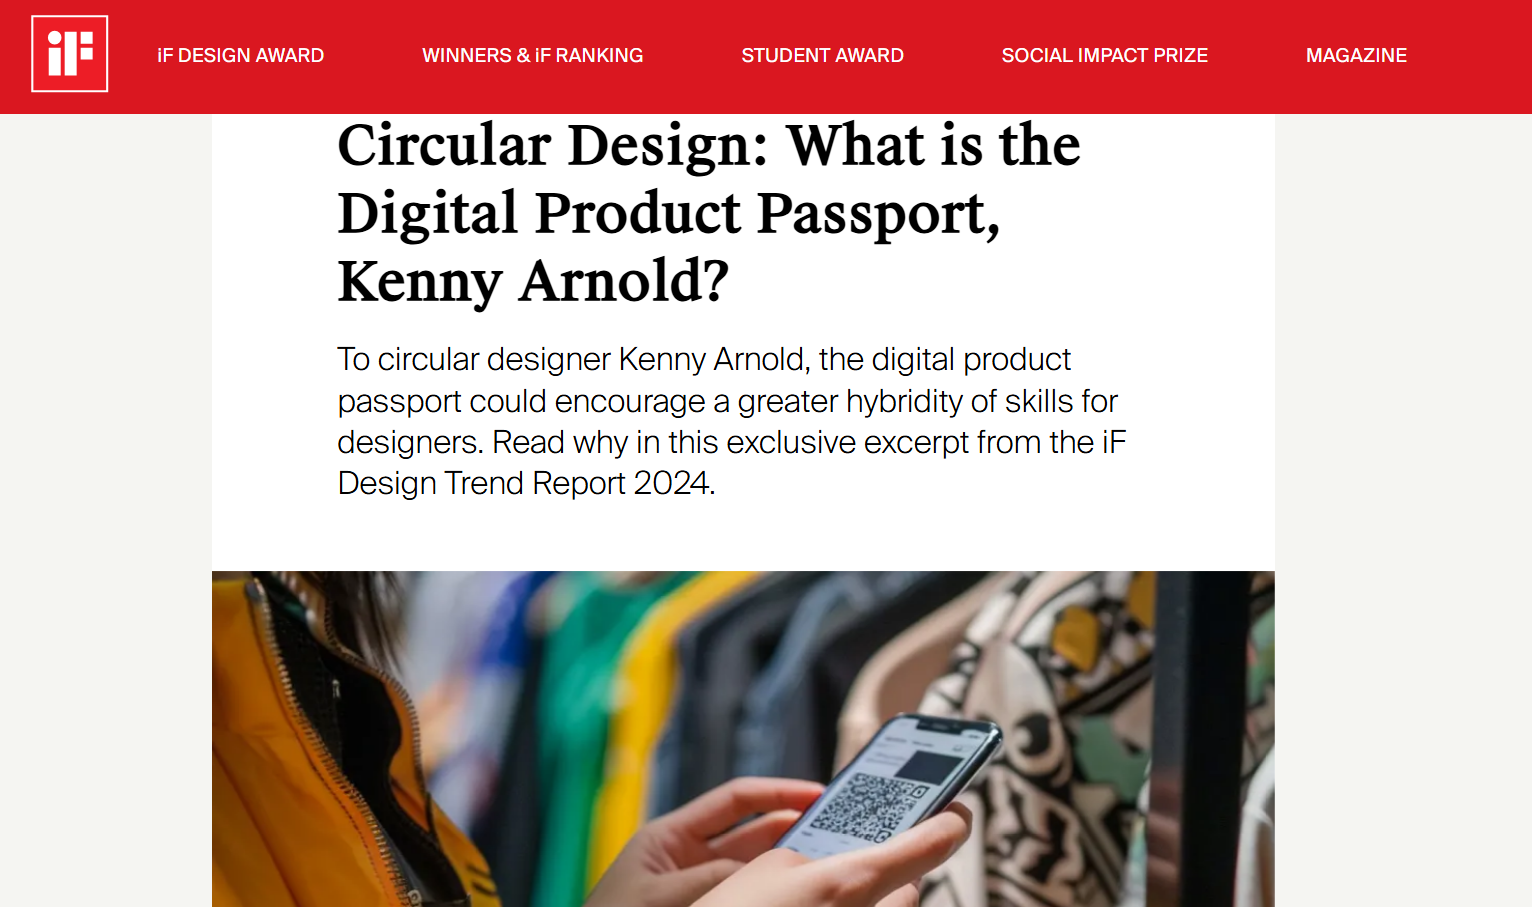
iF Design Award - Eco Expert 2024-25
Awarded $50,000 as a Play Everywhere Challenge winner from KABOOM! and Ralph C Wilson Jr. Foundation to create the Play Path, 2021
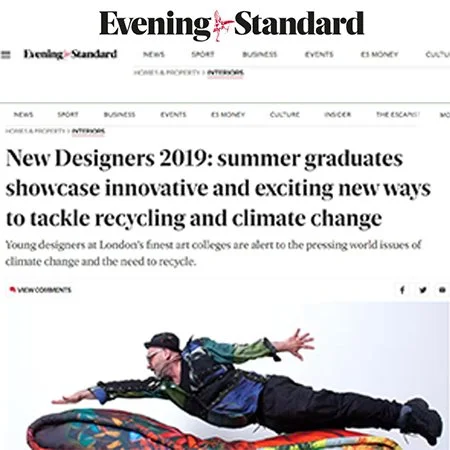
Waterside Gobbler featured in the Evening Standard, 2019

interactive RESEARCH
Electronics Lifecycle Waves
SCROLL DOWN to learn about each oncoming wave of electronics reaching their end-of-life.
Methodology: E-waste projections use sales/lifespan models with Weibull distributions fitted to empirical EU data.
By category:
CRT — EPA RCRA, Electronics Recycling Clearinghouse
Flat Panel — GEM 2020/2024 (5.9Mt in 2022)
Solar — IRENA/IEA-PVPS End-of-Life Report
EV Batteries — UNDP Analysis (2025), IEA Global EV Outlook 2025
Windows 10 — Canalys Research (Dec 2023)
Smartphones — WEEE Forum/UNITAR (Oct 2022)
OPPORTUNITY
According to the 2024 E-waste Monitor the annual generation of e-waste is on track to reach 82 million tons by 2030
Each of the product categories are reaching their end-of-life in cycles. Below is an interactive timeline to explore the oncoming waves
concept
interactive RESEARCH
Critical MINERAL DEMAND
By 2040, the world will need exponentially more of these minerals than it mines today
- LITHIUM
- The "Li" in Li-ion. Every rechargeable battery — phones, EVs, grid storage.
- COBALT
- Stabilizes battery cathodes. ~75% comes from the DRC.
- NICKEL
- Energy density in EV batteries. Also stainless steel, turbine shafts.
- GRAPHITE
- The anode of every lithium-ion battery. No graphite, no rechargeable.
- RARE EARTHS
- Super-strong magnets in EV motors and direct-drive wind turbines.
- COPPER
- The wiring of electrification. EVs use ~4× the copper of a gas car.
- EV sales hitting 20% of new-car sales globally
- Grid-scale battery installations breaking records quarterly
Sources & Methodology
Primary Sources
This visual draws on three forecasts. STEPS and NET ZERO are from the International Energy Agency's Global Critical Minerals Outlook (2024 and 2025 editions). The third scenario, S&P / BNEF, reflects more aggressive copper assumptions from S&P Global's January 2026 study and BloombergNEF's Transition Metals Outlook 2025, which incorporate AI/data-center and defense demand vectors that the IEA's energy-transition focus undercounts.
↗ IEA Global Critical Minerals Outlook 2024
↗ IEA Global Critical Minerals Outlook 2025
↗ S&P Global: Copper in the Age of AI (Jan 2026)
↗ BloombergNEF Transition Metals Outlook 2025
How the Two Views Work
Multiplier view sizes each cube as 10% of that mineral's 2024 production. This makes growth rates comparable across minerals — lithium's 9× pile towers over copper's 1.5× pile, capturing the "lithium sprint" narrative.
Absolute tonnage view uses a shared cube mass of 500,000 tonnes across all minerals. This shows the physical mining and refining build-out — copper towers, lithium nearly disappears. Both views are true; they tell different stories. The multiplier view emphasizes rate of change and supply-chain risk; the absolute view emphasizes scale of the physical extraction industry.
2024 Production Baselines
Absolute tonnage figures use 2024 mine production from the USGS Mineral Commodity Summaries 2025, rounded for legibility.
| Mineral | 2024 | STEPS 2040 | NZE 2040 | S&P/BNEF 2040 |
|---|---|---|---|---|
| Lithium | 240 kt | 1.2 Mt (5×) | 2.16 Mt (9×) | 2.16 Mt (9×) |
| Cobalt | 240 kt | 385 kt (1.6×) | 480 kt (2×) | 480 kt (2×) |
| Nickel | 3.7 Mt | 7.4 Mt (2×) | 7.4 Mt (2×) | 7.4 Mt (2×) |
| Graphite | 1.8 Mt | 3.6 Mt (2×) | 7.2 Mt (4×) | 7.2 Mt (4×) |
| Rare earths | 350 kt | 560 kt (1.6×) | 700 kt (2×) | 700 kt (2×) |
| Copper | 23 Mt | 30 Mt (1.3×) | 34 Mt (1.5×) | 42 Mt (1.83×) |
kt = thousand tonnes; Mt = million tonnes. Rare earth figures are mine production of rare-earth-oxide equivalent. Natural graphite only (synthetic is produced separately).
Scenario Definitions
STEPS (Stated Policies, IEA) reflects only policies governments have actually implemented or legislated. It's "current trajectory."
NZE (Net Zero Emissions by 2050, IEA) is a normative scenario — it models the mineral deployment that would be required to hit the 1.5°C climate goal. It's "what energy transition would take."
S&P / BNEF mirrors NZE on most minerals (because S&P and BloombergNEF do not publish full multi-mineral 2040 scenarios at the IEA's breadth), but uses S&P Global's January 2026 copper outlook of 42 Mt/yr by 2040, which adds four cumulative demand vectors: core economic growth, energy transition, AI/data centers, and defense. This is "what energy transition plus the AI buildout would take." S&P also identifies humanoid robots as a potential fifth vector (1.6 Mt of additional copper at 1 billion units), not included here.
Weight Comparisons
Tonnage equivalents shown in pop-ups are approximations for intuition, not engineering specs:
Eiffel Tower: ~10,100 tonnes of iron. Statue of Liberty: ~225 tonnes (copper + iron + steel). Burj Khalifa: ~500,000 tonnes total mass. Empire State Building: ~365,000 tonnes. Boeing 747: ~180 tonnes empty. Container ship (ULCV): ~220,000 tonnes loaded. Big Mac: ~218 g; the U.S. sells roughly 550 million per year ≈ ~120,000 tonnes. African elephant: ~6 tonnes. Great Pyramid of Giza: ~5,750,000 tonnes.
Other Referenced Figures
DRC cobalt share. The Democratic Republic of the Congo accounted for roughly 74–76% of global mined cobalt in 2024, per USGS Mineral Commodity Summaries and the Cobalt Institute 2024 Market Report.
Mine development lead times. Mines that came online in 2020–2024 took an average of 17.9 years from discovery to first production, per S&P Global Market Intelligence (2025). U.S. lead times are materially longer (~29 years).
Copper supply gap. S&P Global projects a ~10 Mt/yr supply gap by 2040 (42 Mt demand vs ~32 Mt supply); BloombergNEF projects a 19 Mt/yr cumulative gap by 2050. Both assume recycled copper scrap roughly doubles to ~10 Mt/yr.
Battery end-use share. 87% of lithium goes to batteries globally (USGS 2025). For copper, an EV contains roughly 80 kg versus ~20 kg for an internal-combustion car, per Copper Development Association and IEA.
Caveats
These are scenario projections, not forecasts. Actual 2040 demand will depend on battery chemistry shifts (LFP vs. NMC), recycling scale-up, EV adoption rates, AI infrastructure intensity, and policy settings. The IEA notes that accelerated adoption of LFP and sodium-ion chemistries could reduce 2030 battery-metal demand by ~13%. Recycling could cover 10–30% of primary supply needs by 2040.
The S&P/BNEF scenario as constructed here is a hybrid: it uses S&P's copper number combined with NZE assumptions for other minerals, because no single forecaster publishes a fully harmonized "AI-aware" scenario across all six minerals. Read it as a plausible upper bound on copper, not a pre-existing published model.
"Signals to watch" are illustrative indicators drawn from IEA, BloombergNEF, and S&P Global analysis — concrete, observable phenomena that would suggest the scenario is (or is not) tracking. They are not the IEA's own framing.
Multiple sources highlight different aspects of mineral demands are necessary to achieve a net-zero economy, yet a comprehensive overview is difficult to find.