

kenny arnold
FEATURED PROJECTS
Driven by curiosity and built on purpose, this is where bold thinking meets thoughtful execution. Let’s create something meaningful together.
PROJECT
THRIFTSPOT
NYC PLAYS X KABOOM! GRANT RECIPIENT, 2021
OPPORTUNITY
Driven by curiosity and built on purpose, this is where bold thinking meets thoughtful execution. Let’s create something meaningful together.
concept
Driven by curiosity and built on purpose, this is where bold thinking meets thoughtful execution. Let’s create something meaningful together.
PROJECT
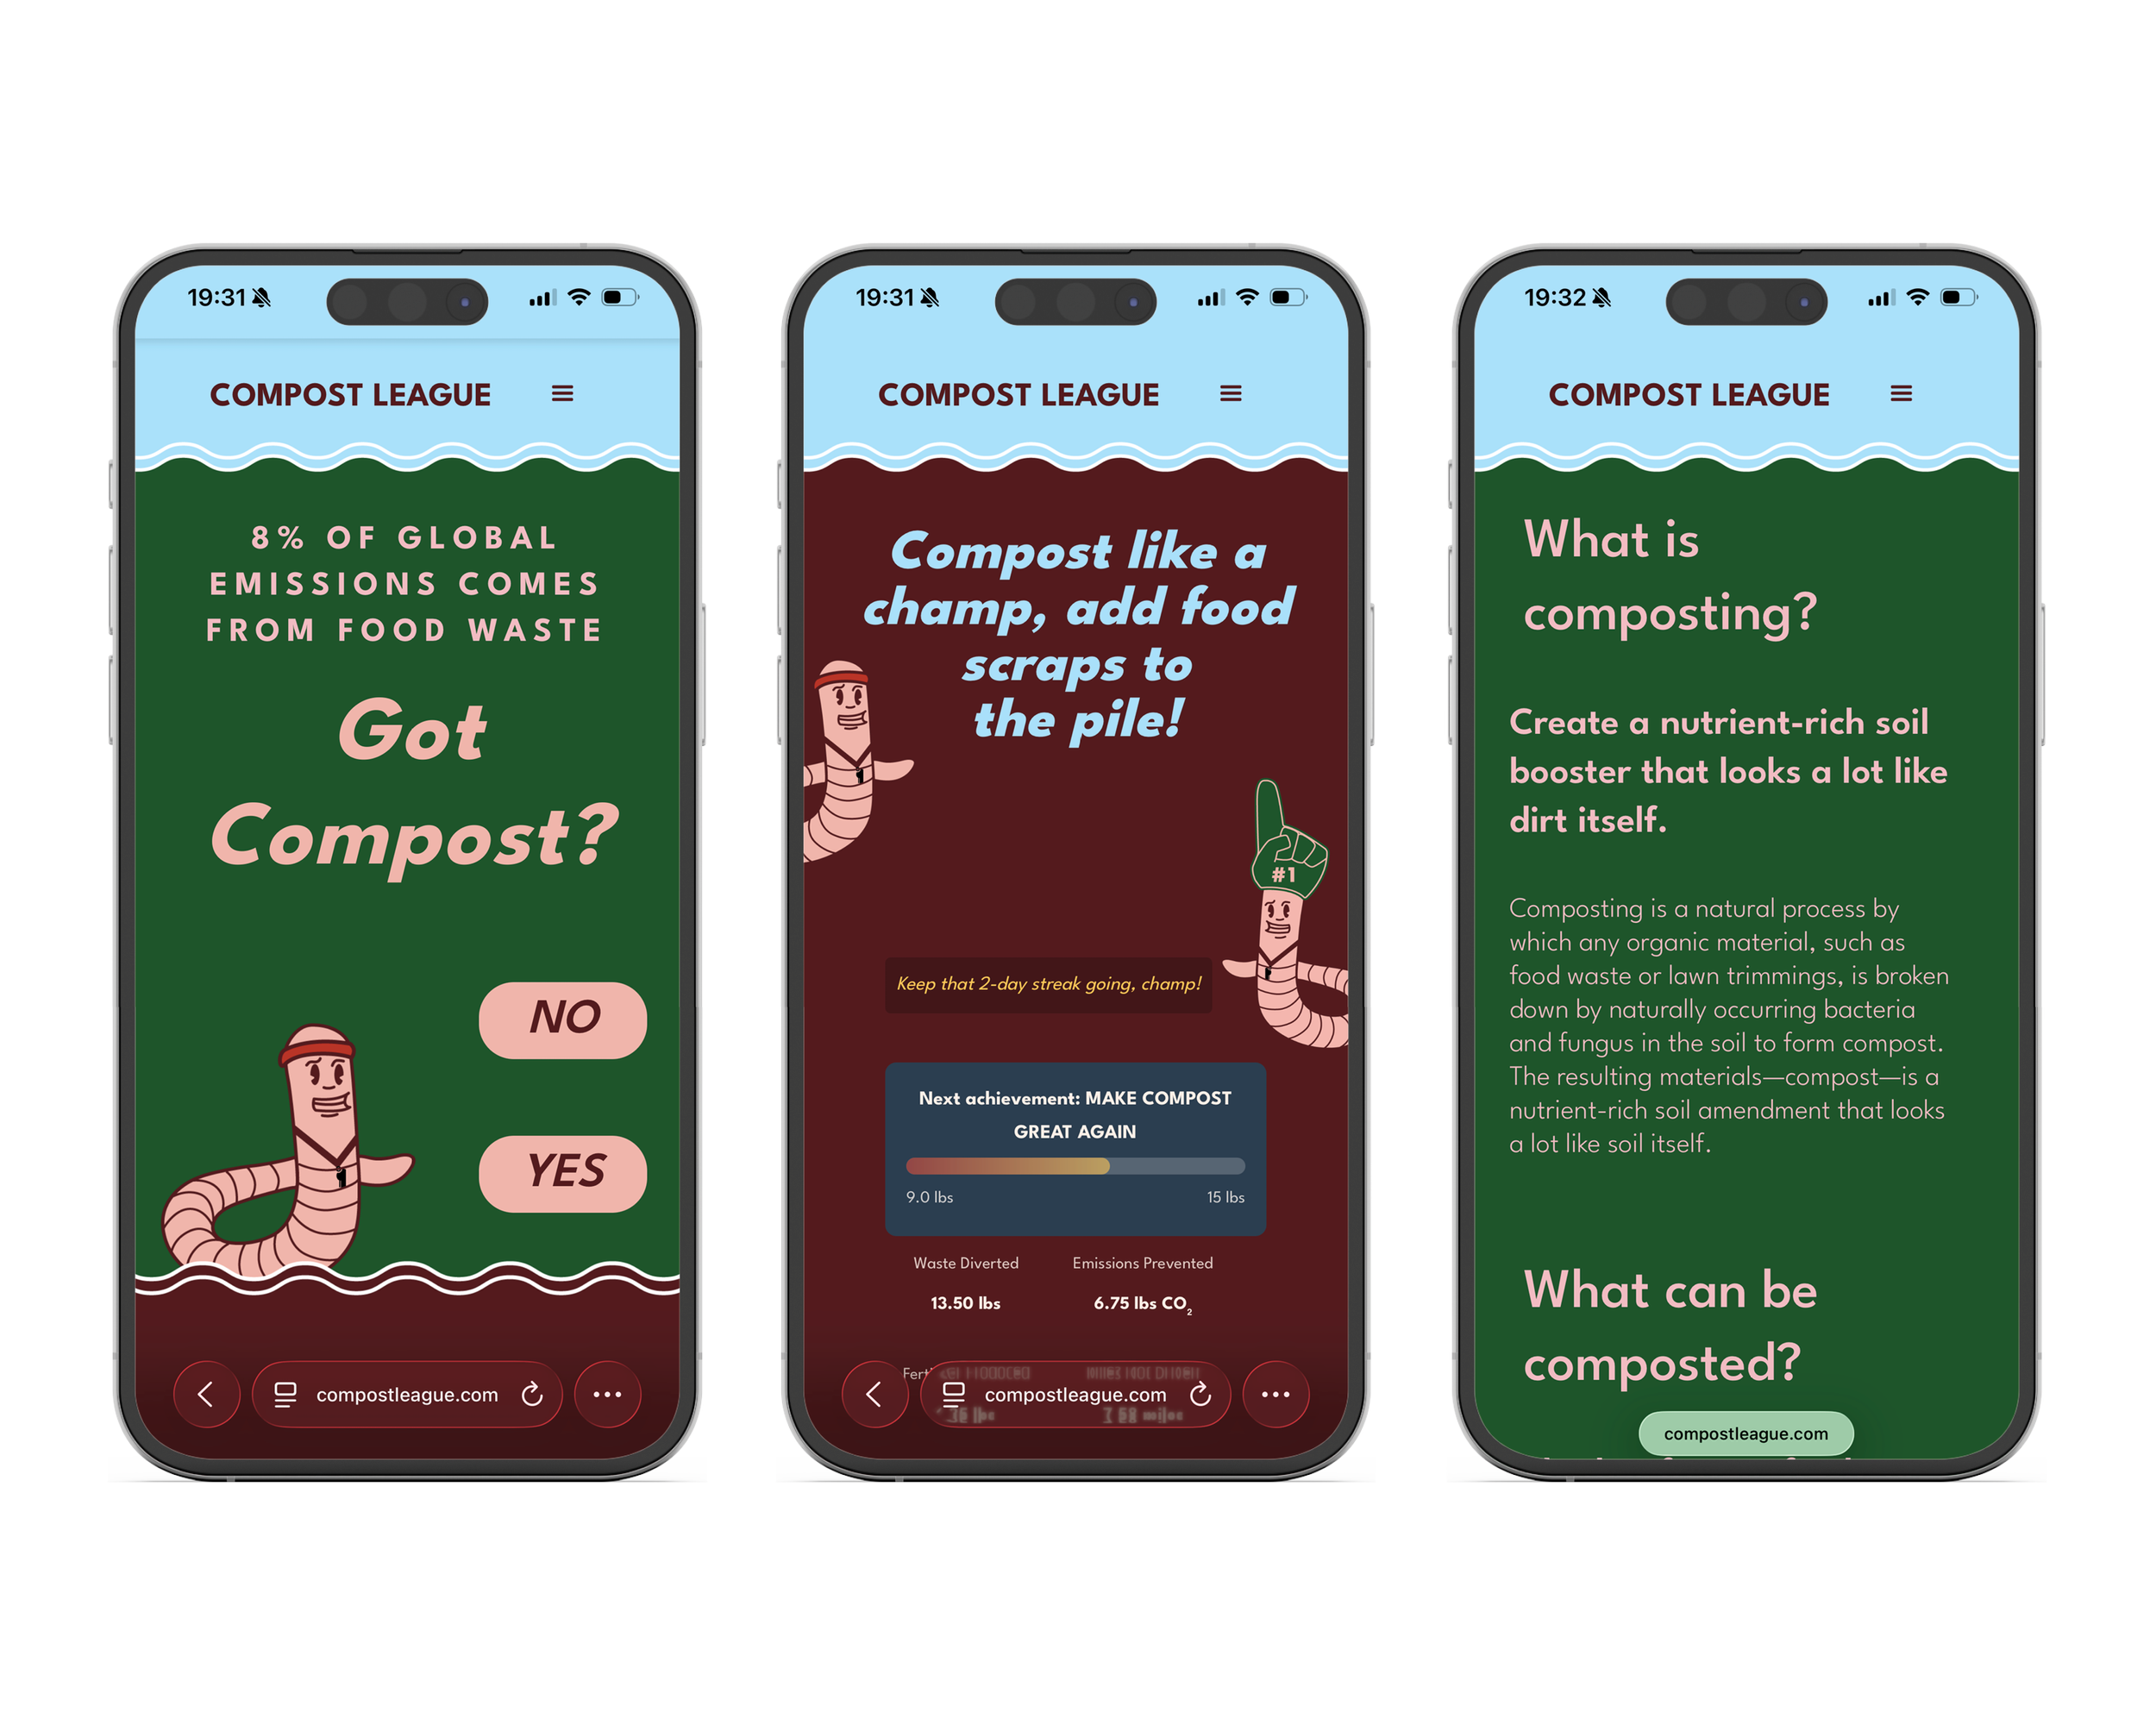
compost league
NYC PLAYS X KABOOM! GRANT RECIPIENT, 2021
OPPORTUNITY
Driven by curiosity and built on purpose, this is where bold thinking meets thoughtful execution. Let’s create something meaningful together.
concept
Driven by curiosity and built on purpose, this is where bold thinking meets thoughtful execution. Let’s create something meaningful together.
PROJECT
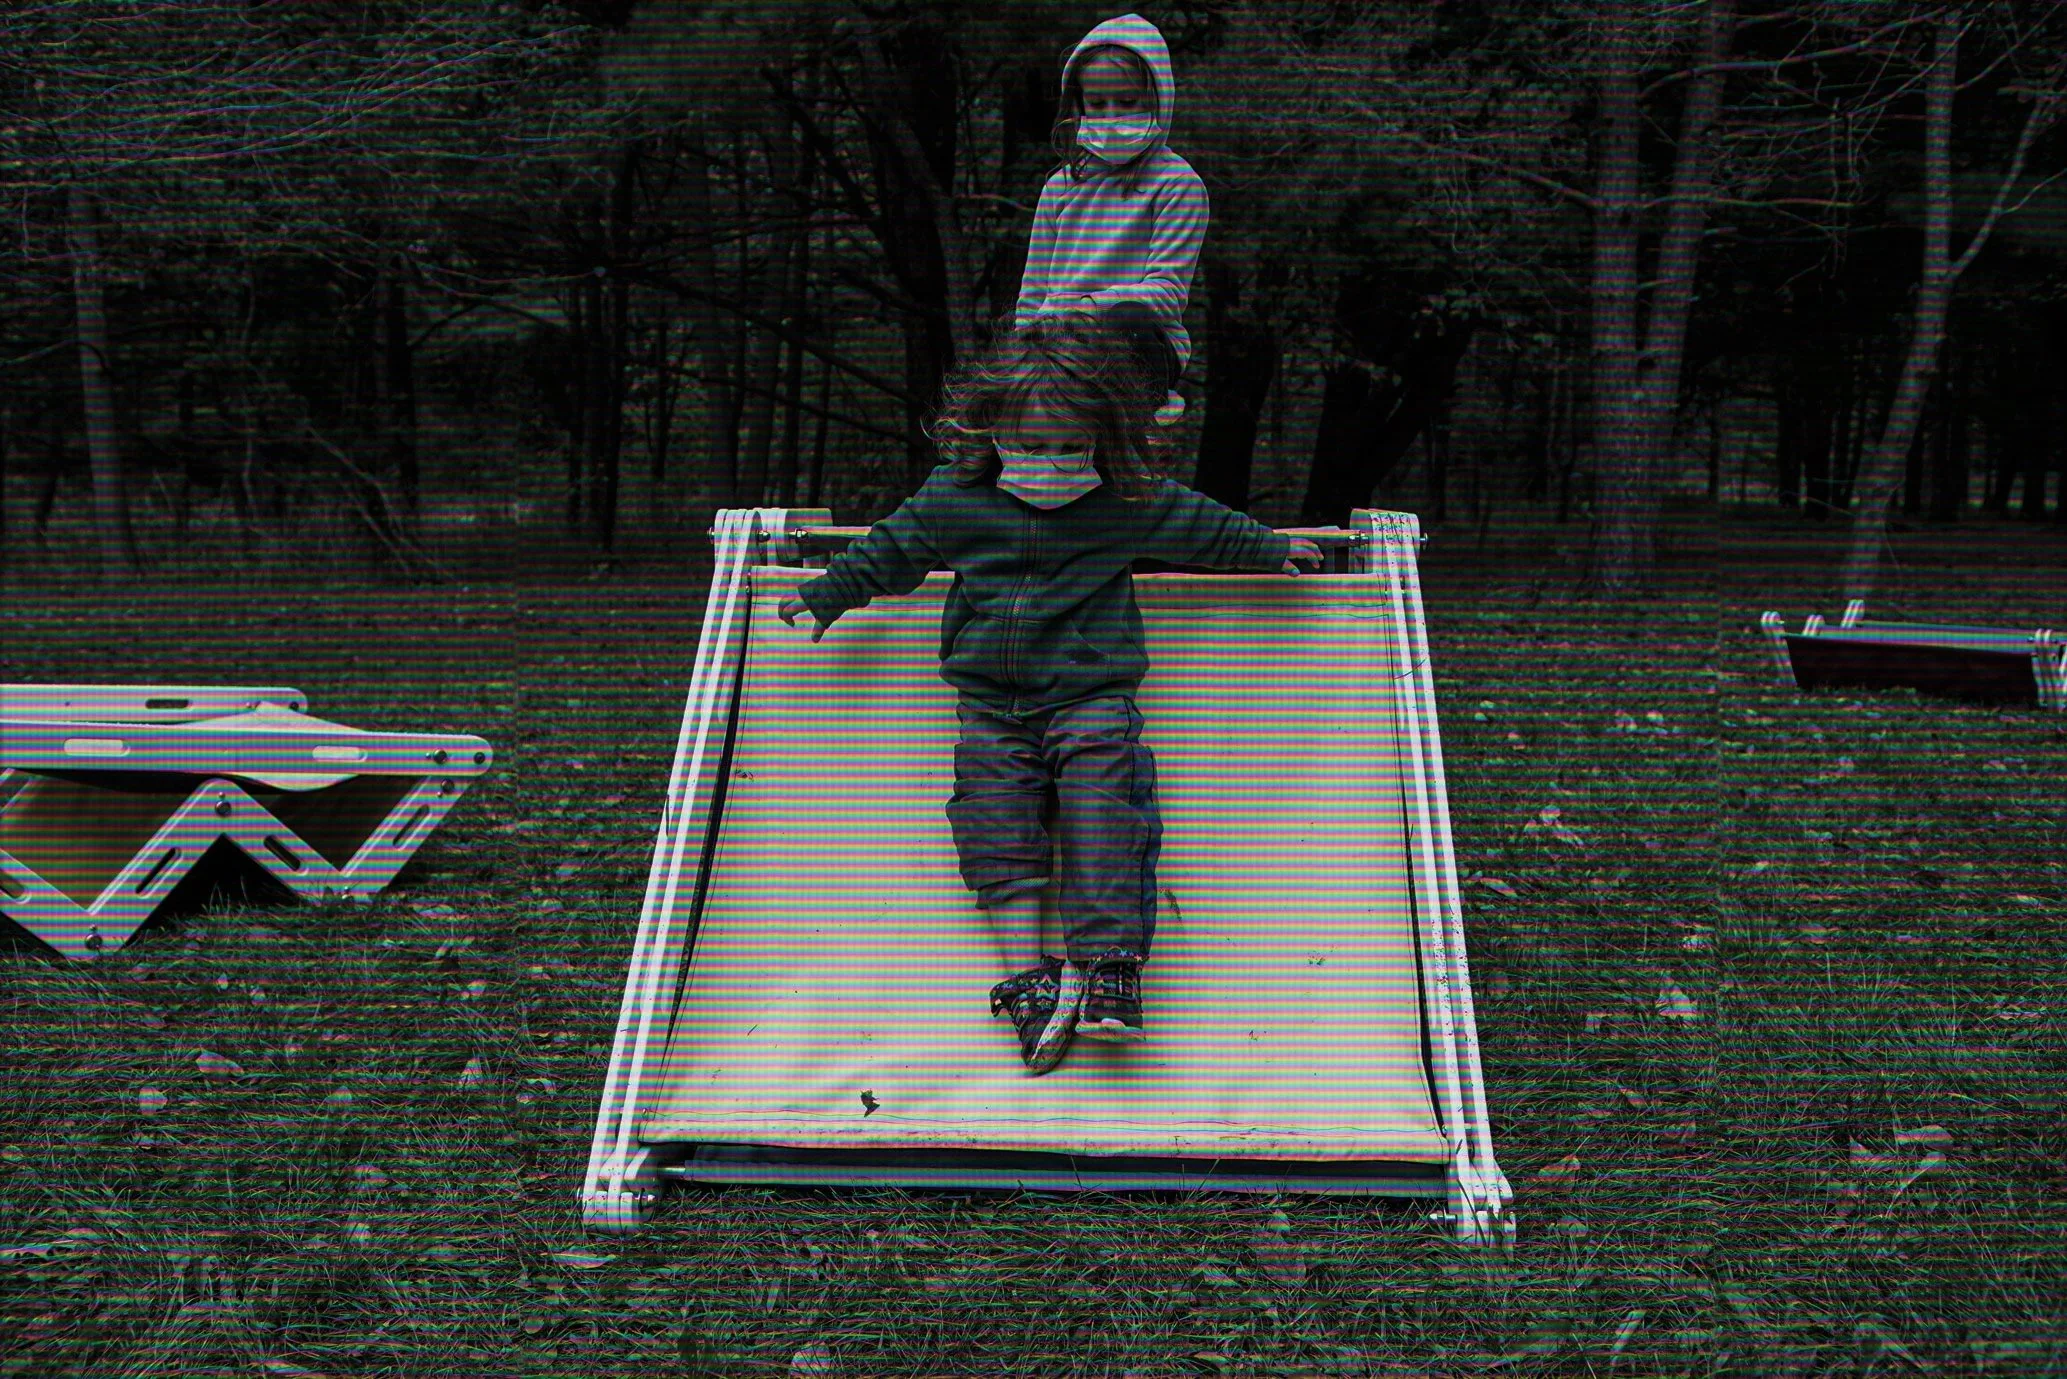
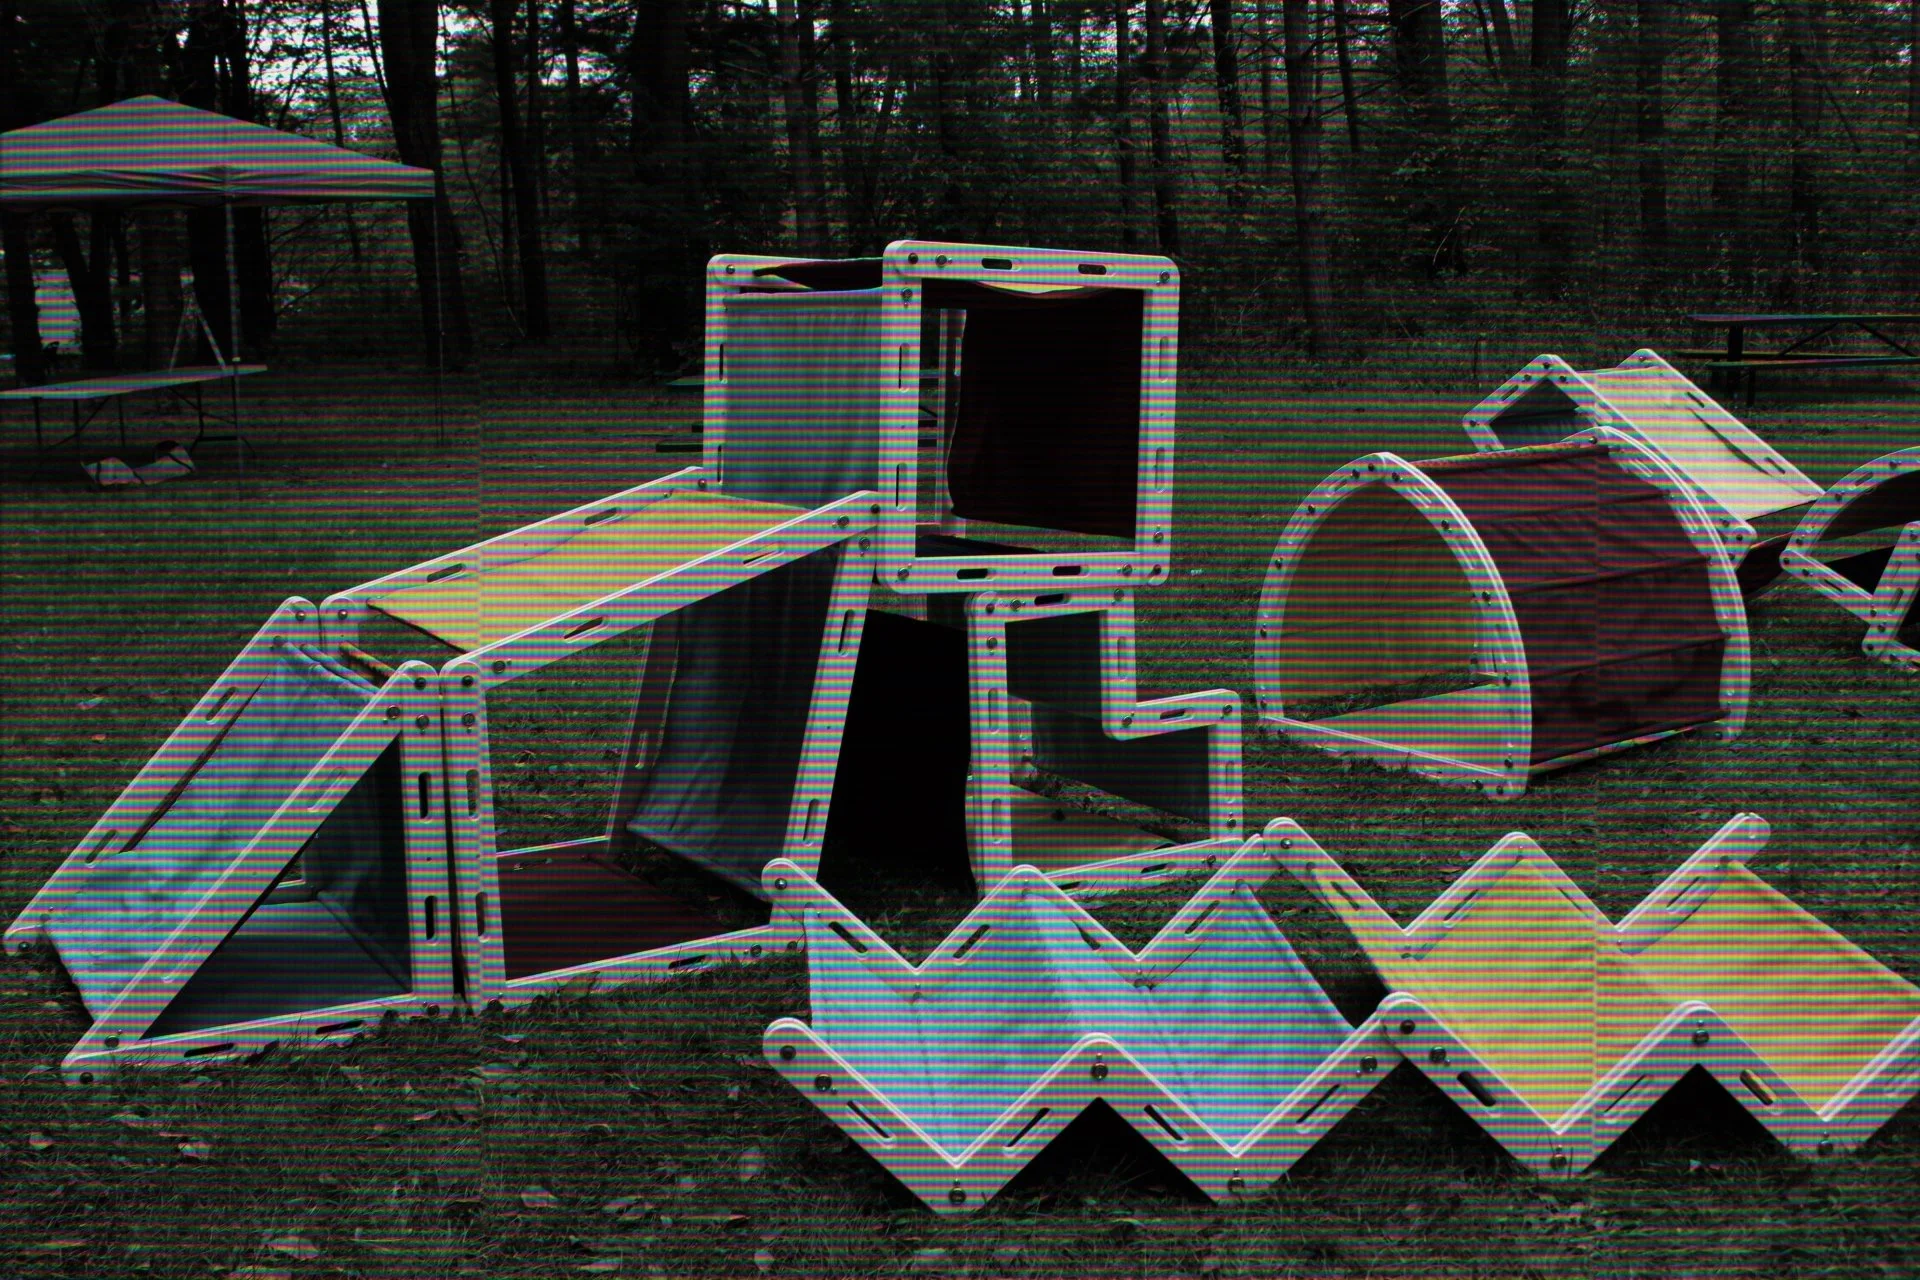
playpath
NYC PLAYS X KABOOM! GRANT RECIPIENT, 2021

OPPORTUNITY
In communities where children lack nearby places to play, sedentary habits form early and persist for life. The gap in accessible play infrastructure doesn't just affect children, it embeds unhealthy patterns into neighborhoods that compound into long-term public health costs.
concept
Play Path is a modular outdoor furniture system co-designed with kids to transform underserved neighborhoods, one play space at a time. A reconfigurable system of outdoor elements built to last, and meant to be rearranged. Every visit is a new experience. Every configuration is a new invitation to move, climb, connect.

PROJECT
WATERSIDE GOBBLER
NYC PLAYS X KABOOM! GRANT RECIPIENT, 2021
OPPORTUNITY
Stand near a trash can long enough and you'll witness something telling, people wanting to put waste where it belongs but often that desire, gives way to hesitation and apathy, when the “right choice” is unclear or inconvenient.
concept
The Waterside Gobbler playfully reframes the act of picking up trash with a gamified fishing experience that creates a direct, tangible relationship between citizens and the waterways they live alongside. While testing in urban canals, the response was immediate and unsolicited — applause from passing boaters, curious crowds at exhibitions, spontaneous requests to participate. The Waterside Gobbler validated a core hypothesis: the public is eager to contribute when the right tools exist
PROJECT
ATLAS CIRCULAR
NYC PLAYS X KABOOM! GRANT RECIPIENT, 2021
OPPORTUNITY
The circular economy touches every aspect of how we live — yet for most people, it remains an abstract idea rather than a daily practice. The tools and infrastructure to shop, donate, repair, and recirculate materials already exist in most communities. They're just invisible.
concept
This project makes the existing network visible. An open-source map of locally available resources for repair, reuse, upcycling, and zero-waste living — built for people and organizations who are ready to act, but don't know where to start.
Press
if design
NYC PLAYS X KABOOM! GRANT RECIPIENT, 2021
OPPORTUNITY
Contributed to the iF Design Award by representing the Ellen MacArthur Foundation as a sustainability and circular economy expert and supporting the jurors
concept
Driven by curiosity and built on purpose, this is where bold thinking meets thoughtful execution. Let’s create something meaningful together.
PROJECT
CANu Blocks
NYC PLAYS X KABOOM! GRANT RECIPIENT, 2021
OPPORTUNITY
Driven by curiosity and built on purpose, this is where bold thinking meets thoughtful execution. Let’s create something meaningful together.
concept
Driven by curiosity and built on purpose, this is where bold thinking meets thoughtful execution. Let’s create something meaningful together.
interactive tool
Critical minerals in phones
Click on an element below to learn how it is used in your cell phone.
Click a colored element to see its function, content, recycling rate, and projected demand. Click a gray element to see its status.
Element content & supply risk — brightly colored elements are present in the phone
[S1] Orton Geological Museum, Ohio State University — ortonmuseum.osu.edu
[S2] USGS Geologic Survey (GIP 167) — pubs.usgs.gov
[S3] He et al. (2019) / Cucchiella et al. (2015) — metal content (g/unit) in smartphones
[S4] Fairphone / CompoundChem / Cobalt Institute — recycling rates and supply chain risk
[S5] IEA / Statista / Cobalt Institute Forecasts — projected demand growth to 2030, primarily driven by EVs and energy storage
OPPORTUNITY
The elements in a cellphone are increasingly valuable, yet most don’t know what’s inside
concept
Learn about the elements inside your phone based on the available research and public information
interactive tool
Electronics Lifecycle Waves
SCROLL DOWN to learn about each oncoming wave of electronics reaching their end-of-life.
Methodology: E-waste projections use sales/lifespan models with Weibull distributions fitted to empirical EU data.
By category:
CRT — EPA RCRA, Electronics Recycling Clearinghouse
Flat Panel — GEM 2020/2024 (5.9Mt in 2022)
Solar — IRENA/IEA-PVPS End-of-Life Report
EV Batteries — UNDP Analysis (2025), IEA Global EV Outlook 2025
Windows 10 — Canalys Research (Dec 2023)
Smartphones — WEEE Forum/UNITAR (Oct 2022)
OPPORTUNITY
According to the 2024 E-waste Monitor the annual generation of e-waste is on track to reach 82 million tons by 2030
concept
Each of the product categories are reaching their end-of-life in cycles. Below is an interactive timeline to explore the oncoming waves
interactive tool
Critical MINERAL DEMAND
Explore the dashboards below to visualize the demand for critical minerals and potential risks
🔋 Key Demand Drivers
Electric Vehicles
- Each EV battery requires ~200 kg of minerals
- EVs account for 70% of cobalt demand growth
- Lithium demand for EVs grows 9× by 2040 (NZE)
Grid & Renewables
- Copper demand from grid expansion up 50%
- Rare earths essential for wind turbine magnets
- Battery storage adding significant demand
🇨🇳 China
🇨🇩 DRC
🇮🇩 Indonesia
🇦🇺 Australia
⚠️ Supply Chain Vulnerabilities
- Single point of failure: China controls 60–90% of refining for most battery metals
- Export restrictions: Dec 2024 — China restricted exports of several rare earths
- DRC cobalt: 73% of mining, with ongoing conflict and artisanal mining concerns
- Lead times: New mines take ~16–20 years to develop
- Investment slowing: 2024 investment grew only 5% (vs 14% in 2023)
🚨 N-1 Supply Risk Analysis
If the largest supplier were removed from the market, how much of global demand could be met?
- Graphite (excl. China): Only 35% of demand could be met
- Rare Earths (excl. China): Only 40% of demand could be met
- Lithium (excl. Australia): 65% of demand could be met
- Cobalt (excl. DRC): 65% of demand could be met
- Nickel (excl. Indonesia): 70% of demand could be met
♻️ Copper
♻️ Lithium
♻️ Cobalt
🔄 Circular Economy Opportunities
Battery Recycling Scale-Up
- EV batteries reaching EOL: 1.5M tonnes by 2030
- Battery recycling capacity growing 25% annually
- Hydrometallurgical processes achieving 95% recovery
- EU Battery Regulation mandates recycled content
Policy Drivers
- EU: 16% recycled cobalt, 6% lithium by 2031
- US IRA incentives for domestic recycling
- China targeting 70% battery recycling by 2030
- Extended Producer Responsibility expanding
Scenarios:
- STEPS: Stated Policies Scenario — based on current policies
- NZE: Net Zero Emissions by 2050 Scenario
Additional sources: USGS Mineral Commodity Summaries 2024, European Commission Critical Raw Materials List, S&P Global, Benchmark Mineral Intelligence
OPPORTUNITY
Multiple sources highlight different aspects of mineral demands are necessary to achieve a net-zero economy, yet a comprehensive overview is difficult to find.
concept
Explore the dashboards below to visualize the demand for critical minerals, where they are sourced from, current recovery rates, and circular economy opportunities.